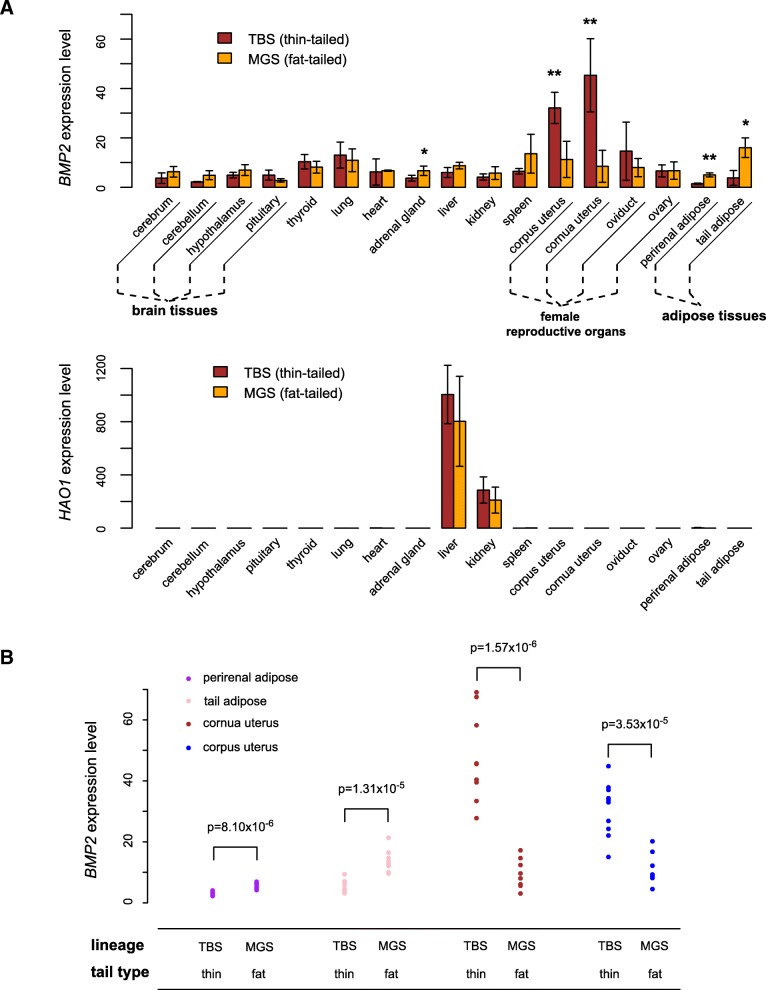
Fig. 6.
Gene expression difference between fat-tailed and thin-tailed sheep. a Comparison of gene expression level for BMP2 and HAO1 in 17 tissue types between TBS and MGS (n = 4 for each). **, student’s t test P value < 0.01; *, student’s t test P value < 0.05. b Validation of BMP2 expression in adipose and uterine tissues using additional samples (n = 8 for each)

