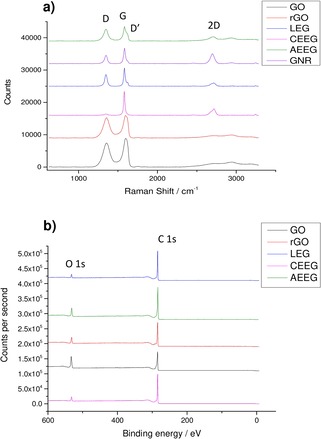
Figure 1.

a) Raman spectra of all the graphene materials supported on the PVDF filter paper. The main Raman peaks of the materials are labelled. b) XPS of the graphene materials showing the carbon 1 s and the oxygen 1 s peaks. The relative intensity of the peaks was used to calculate the composition of the samples.
