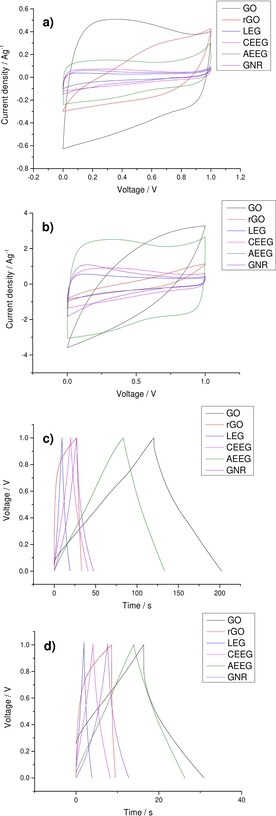
Figure 6.

Comparison of the CVs of all the graphene materials at two different scan rates a) 10 mVs−1 and b) 100 mVs−1 and of the GCDs of all the graphene materials at two different current densities c) 0.5 A g−1 and d) 2 A g−1 after 10,000 cycles at 1 A g−1.
