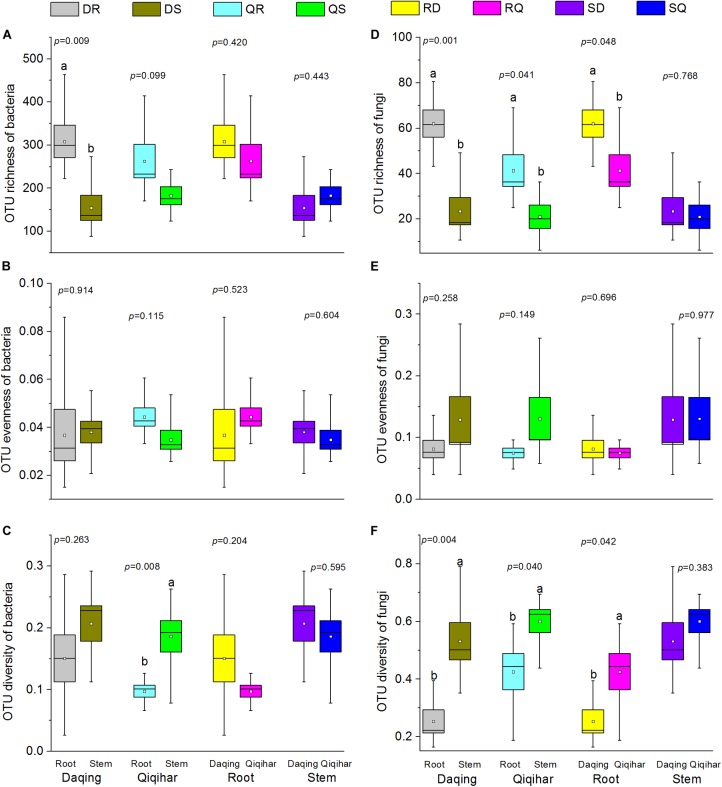
FIGURE 2.
Alpha diversity estimates of bacterial and fungal communities in different environmental conditions and different tissues. (A) Operational taxonomic unit (OTU) richness of bacteria. (B) OTU evenness of bacteria. (C) OTU diversity of bacteria. (D) OTU richness of fungi. (E) OTU evenness of fungi. (F) OTU diversity of fungi. The richness, evenness, and diversity of bacterial and fungal communities are displayed with the bootstrap, simpsoneven, and Shannon indices, respectively. Box plots display the first (25%) and third (75%) quartiles, the median, mean, and the maximum and minimum observed values within each data set. Alpha diversity estimates represent three biological replicates for each set. Data were analyzed using Student’s t-test. The overall plant compartment effects (p-value) are displayed at the top of each graph. Significant differences (p < 0.05) across plant compartments are indicated using lowercase letters.

