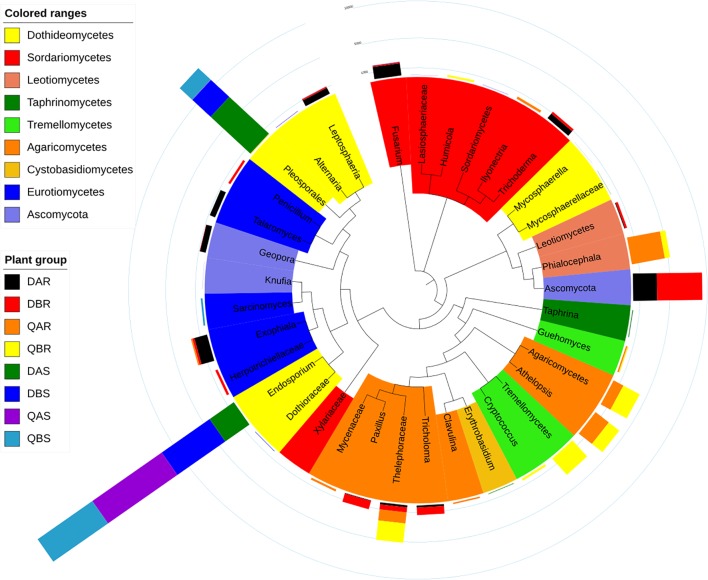
FIGURE 7.
Top operational taxonomic units (OTU) members of the fungal microbiome. A taxonomic dendrogram showing the core fungal microbiome of each plant group. Color ranges identify classes within the tree. Colored bars represent the relative abundance of each OTU in each plant group. The taxonomic dendrogram was generated with one representative sequence of each OTU using FastTree and displayed using iTOL (Interactive Tree Of Life). The total relative abundances of all OTUs and the significant effects across plant compartments are listed in Supplementary Table S9.

