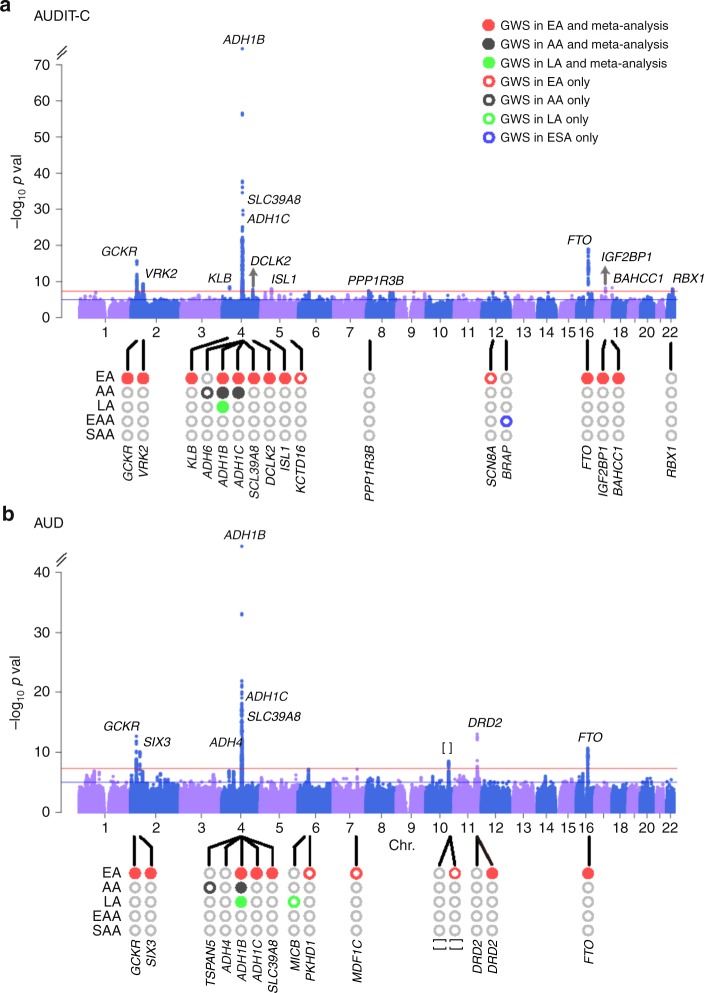
Fig. 1.
Manhattan plots for age-adjusted mean AUDIT-C score and AUD diagnosis. a Manhattan plot of the genome-wide association meta-analysis of AUDIT-C across all five populations (N = 272,842). b Manhattan plot of the genome-wide association meta-analysis of AUD across five populations (55,584 cases and 218,807 controls). Red lines show the genome-wide significance level (5.0 × 10⁻⁸). EA: European American, AA: African American, LA: Hispanic or Latino, EAA: East Asian American, SAA: South Asian American. Labeled genes at the top of the peaks indicate completely independent signals after conditional analysis in meta-analysis. Population-specific loci are labeled at the bottom of the circles in the lower part of each figure. []: no genes within 500 kb to the lead SNP

