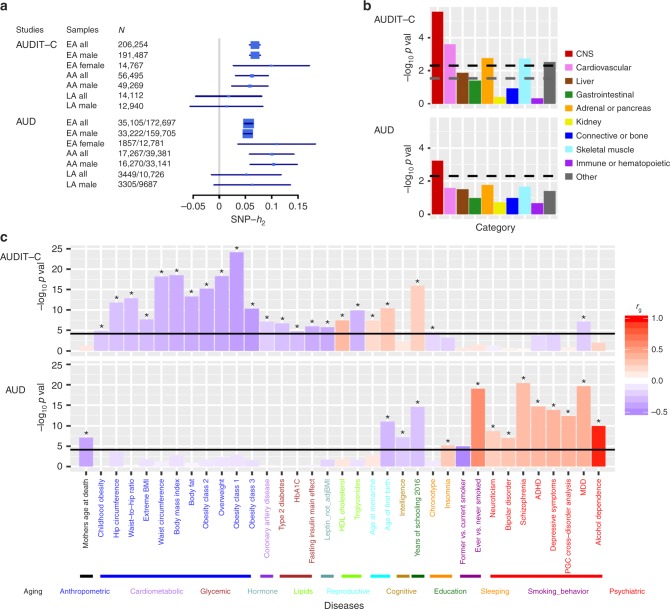
Fig. 2.
Heritability estimate, partitioning enrichments of heritability, and genetic correlation analyses using LD score regression. a SNP-based heritability for AUDIT-C and AUD in the three populations and sex-stratified samples adequate in size for the analysis. b Partitioned heritability enrichment of cell type groups for AUDIT-C and AUD. Ten cell types tested were corrected for multiple testing. The black dashed line is the cutoff for Bonferroni-corrected significance. The gray dashed line is the cutoff for FDR < 0.05. c Genetic correlations with other traits. Data from 714 publicly available datasets (221 published and 493 unpublished from UK Biobank) were tested and corrected for multiple comparisons. The significantly correlated traits presented are for published data. Black lines are the cutoff for Bonferroni-corrected significance, with asterisks showing traits significant after correction. The traits are grouped into different categories and sorted by the genetic correlations with AUDIT-C (upper panel) or AUD (lower panel). CNS central nervous system, ADHD attention deficit hyperactivity disorder, MDD major depressive disorder

