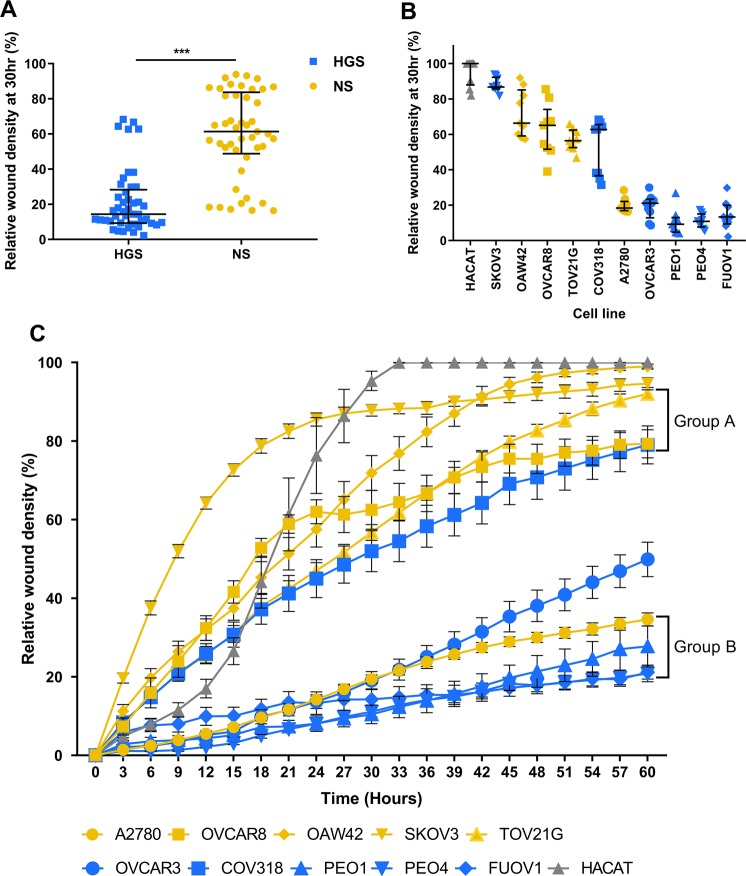
Figure 2.
Wound healing behaviour. (A). Relative wound density at 30 hr for high-grade serous (HGS) cell lines compared to non-serous (NS) cell lines (median ± IQR). HGS median = 14.36 ± 19.03, NS median = 61.38 ± 34.9 Mann-Whitney U test, p < 0.001, U = 1795. (B). Relative wound density at 30 hr for each cell line (median ± IQR). (C). Relative wound density over 60 hours (mean ± SEM). Two-way repeated measures ANOVA identifies two populations of cell lines (p < 0.001). Group A cell lines (COV318, TOV21G, OVCAR8) show no significant difference between relative wound density at >75% of time points (p < 0.005). Group B cell lines (A2780, PEO1, PEO4, FUOV1) show no significant difference between relative wound density at all time points (p < 0.005). (HGS: blue, NS: yellow, Control: grey). Experiments were carried out in triplicate on 3 separate occasions for each cell line. ***p < 0.001.

