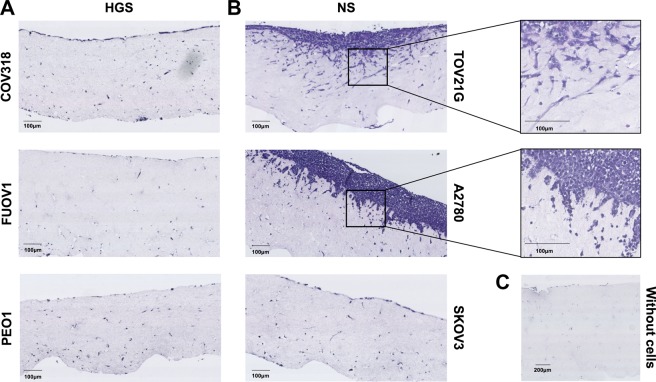
Figure 5.
Organotypic invasion assay. Representative images of haematoxylin and eosin (H&E) stained sections showing cell lines cultured on top of collagen/fibroblast matrices at day 10 of the organotypic invasion assay. Images captured using Hamamatsu Nanozoomer XR at 40X objective magnification. (A). High-grade serous (HGS) cell lines COV318, FUOV1 and PEO1. (B). Non-serous (NS) cell lines TOV21G, A2780 and SKOV3. TOV21G invaded to a maximum depth of 250 µm. A2780 invaded to a maximum depth of 150 µm. (C). Collagen/fibroblast matrix with no cell lines cultured on top. Experiments were carried out on 3 separate occasions for each cell line.

