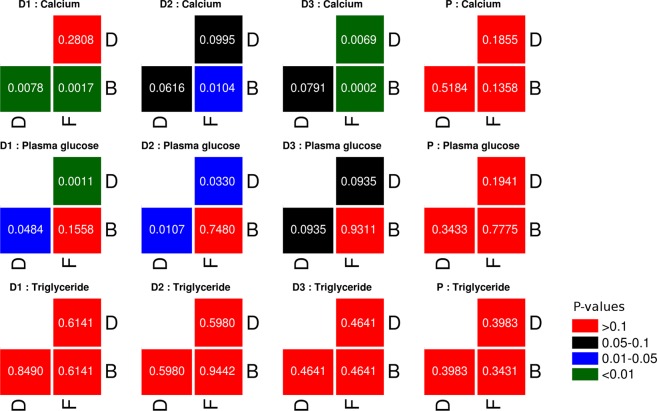
Figure 6.
Statistical comparison of individual biochemical test parameters (grouped by dosage type and study phase). Results of Mann-Whitney rank-sum test carried out between values obtained for an individual biochemical test (e.g. triglyceride). For each dosage type (D1, D2, D3, or P) the test was carried out between (i) Set of values obtained from study participants belonging to a dosage type in the basal phase (B) vs. corresponding values in the dosage phase (D), (ii) Set of values obtained from study participants belonging to a dosage type in the dosage phase (D) vs. all samples in the follow-up phase (F), and (iii) Set of values obtained from study participants belonging to a dosage type in the basal phase (B) vs. all samples in the follow-up phase (F).

