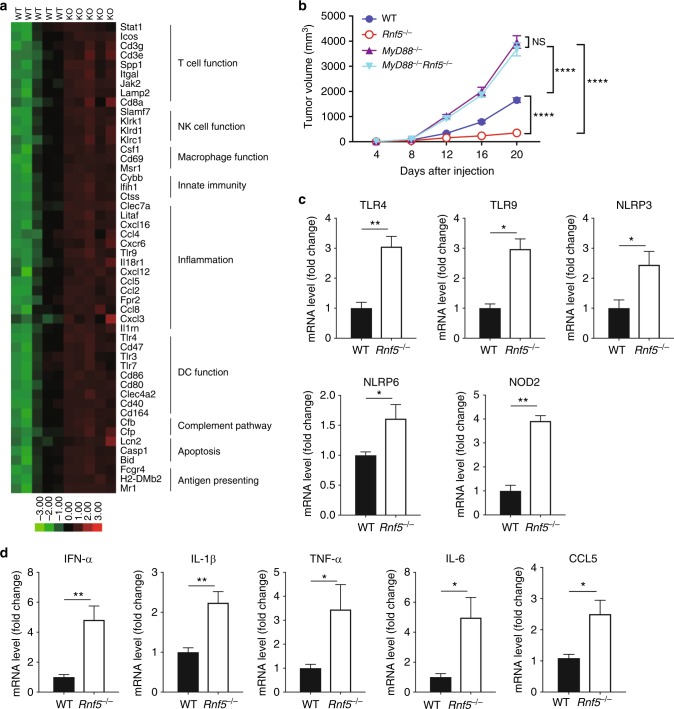
Fig. 2.
Enhanced inflammasome and pathogen receptor signaling in Rnf5−/− mice. a NanoString analysis of PanCancer Immune Profiling genes in tumors from WT and Rnf5−/− mice. The heatmap shows 47 genes with >1.2-fold (P < 0.05) differences in expression between YUMM1.5 tumors from the two genotypes (n = 5) at 10 days after injection. b Growth of B16F10 melanoma cells after subcutaneous injection of 106 cells into WT, Rnf5−/−, MyD88−/− and MyD88−/−Rnf5−/− mice (WT, Rnf5−/−, n = 6; MyD88−/−, n = 5; MyD88−/− Rnf5−/−, n = 8). c qRT-PCR analysis of pathogen receptor mRNA levels in IECs from tumor-bearing WT or Rnf5−/− mice (n = 4). d qRT-PCR analysis of cytokine and chemokine mRNA levels in IECs isolated from the small intestines of tumor-bearing WT or Rnf5−/− mice (n = 4). Data are representative of three independent experiments (c, d), two independent experiments (b) or one experiment (a) ≥5 mice per group. Graphs show the mean ± s.e.m. *P < 0.05, **P < 0.005, ***P < 0.001, ****P < 0.0001 by two-tailed t test or Mann–Whitney U test (c, d) or two-way ANOVA with Sidak’s correction (b)

