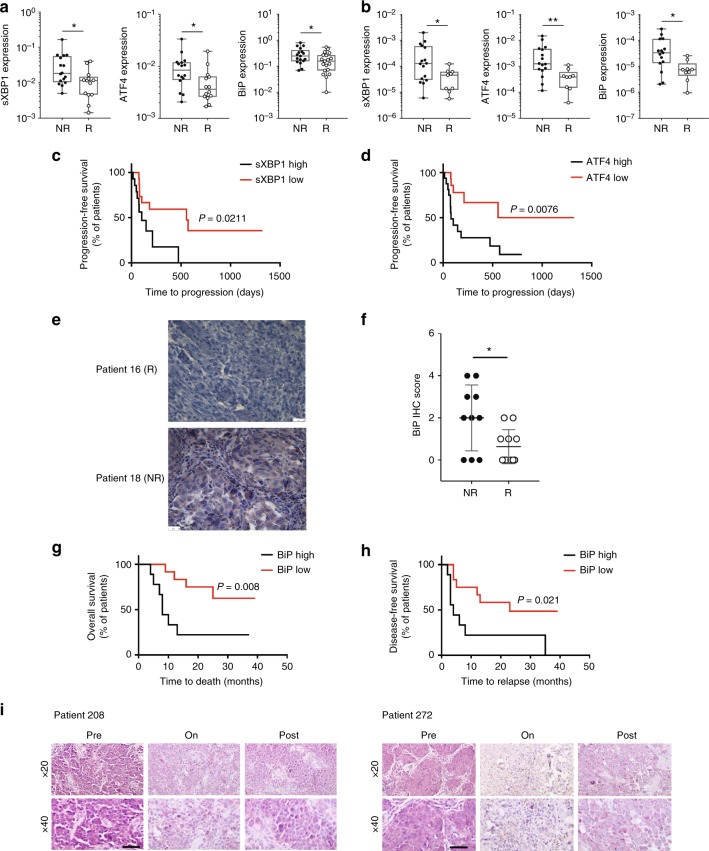
Fig. 7.
Altered UPR in melanoma responders of anti-CTLA-4 immune therapy. a Analysis of ER stress markers genes in non-responders (NR) (n = 16) and responders (R) (n = 14) to immune checkpoint therapy in melanoma samples from MGH/DFCC (USA). b Analysis of ER stress markers genes in NR (n = 16) and R (n = 9) to anti-CTLA-4 immunotherapy in melanoma samples from Zurich Hospital (Switzerland). c Kaplan–Meier curves for progression-free survival probability in melanoma patients demonstrating low (n = 15 patients) versus high sXBP1(n = 14 patients) in tumor specimens obtained before immune checkpoint therapy at MGH/DFCC. d Kaplan–Meier estimates of progression-free survival probability in melanoma patients demonstrating low (n = 14 patients) versus high ATF4 (n = 16 patients) in tumor specimens obtained before immune checkpoint therapy in melanoma samples at MGH/DFCC. e Representative micrographs of IHC staining of BiP after anti-PD-1 immunotherapy in melanoma samples obtained at Rambam Health Care Center (Israel) (scale bar = 25 μm). f IHC score of BiP staining in NR (n = 10) and R (n = 11) to anti-PD-1 immunotherapy in melanoma samples from Rambam Health Care Center (Israel). g, h Kaplan–Meier estimates of (g) overall survival and (h) disease-free survival probability in melanoma patients demonstrating low (<25%, n = 12 patients) versus high melanoma cell expression of BiP (>25%, n = 9 patients) in tumor biospecimens obtained before initiation of systemic anti-PD-1 antibody treatment in melanoma samples from Rambam Health Care Center (Israel). i IHC staining of BiP in melanoma samples from select patients prior to, on and after immunotherapy treatment from MGH/DFCC (USA). Scale bar = 50 μm. Graphs show the mean ± s.e.m. *P < 0.05, **P < 0.005, ***P < 0.001, ****P < 0.0001 by two-tailed t-test or Mann–Whitney U test (a, b, f) or log-rank test (c, d, g, h)

