Fig. 2.
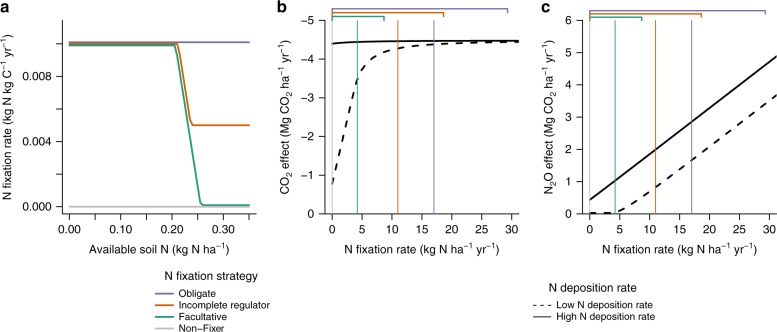
Mechanisms that drive the CO2 and N2O effects of nitrogen-fixing trees. a N fixation rate as a function of available soil N for the three N fixation strategies examined in the model (the horizontal gray line represents a zero N fixation rate for non-fixing trees). b CO2 effect. CO2 sequestration increases with increasing N fixation rate when N is limiting. When N supply to the ecosystem is sufficient to alleviate N limitation, CO2 sequestration plateaus with increasing N fixation rate. This plateau occurs at a lower N fixation rate under high N deposition than under low N deposition. c N2O effect (displayed in units of CO2 radiative equivalents). Increasing N fixation rate does not stimulate soil N2O emissions when N is limiting. When N supply to the ecosystem is sufficient to alleviate N limitation, soil N2O emissions increase with increasing N fixation rate. This increase occurs at a higher N fixation rate under low N deposition than under high N deposition. The black curves in b and c represent the CO2 and N2O effects respectively of an ecosystem with a tropical forest parameterization, a single biomass C pool, and a prescribed constant N fixation rate per unit biomass C. The vertical purple, orange, and green lines in b and c represent average N fixation rates over 100 years for the three N fixation strategies examined in the model (the vertical gray line represents a zero N fixation rate over 100 years for non-fixing trees). The corresponding brackets indicate the range of N fixation rates over 100 years for the three N fixation strategies examined in the model. The low N deposition rate is from Galloway et al.23 and the high N deposition rate is derived from Dentener et al.12. Overall, a–c show that N fixation drives cooling when N is limiting (low N fixation and/or N deposition) and warming when N is not limiting (high N fixation and/or N deposition)

