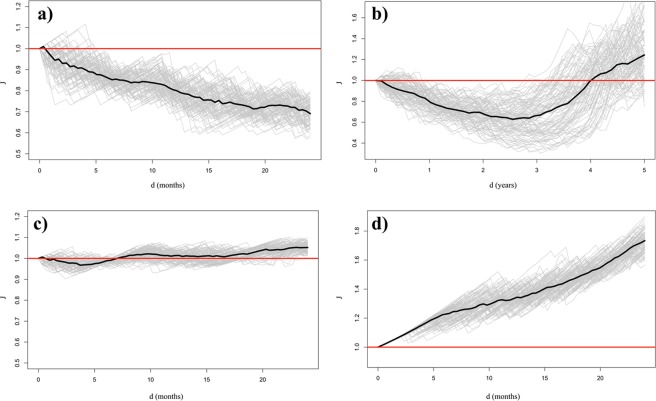
Figure 2.
How to use and interpret the J-function. Panels (a) and (b): Analysis of the large-scale heat stress events that have occurred in the wheat areas of China and India (conditioning on China events). Panel (a): Estimated J-functions based on perturbed occurrence times at the monthly scale. Panel (b): Estimated J-functions based on perturbed occurrence times at the annual scale. Panel (c): Estimated J-functions for drought events in the wheat producing regions of India and heat stress events in the wheat producing region of Ukraine (conditioning on Indian events). Panel (d): Estimated J-function for heat stress events in the wheat producing regions of India. Bold lines represent the median of the ensemble. In all cases the perturbation is uniformly distributed.

