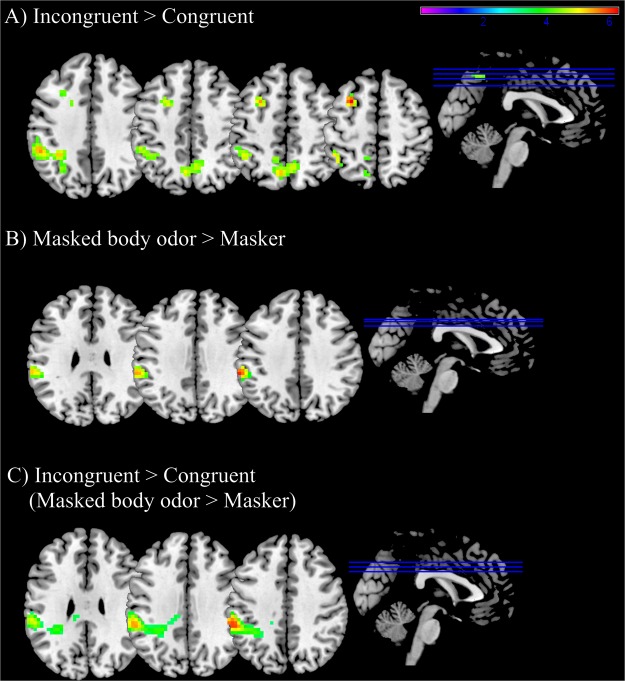
Figure 3.
Brain activation maps showing significant cluster of activations for (A) Incongruent >Congruent: significant activations in the left middle frontal gyrus, left inferior parietal gyrus and bilateral precuneus; (B) Masked body odor >Masker: significant activations in the left supramarginal gyrus; (C) Incongruent (masked body odor >masker) >Congruent (masked body odor >masker): significant activations in the left supramarginal gyrus. Statistical maps are derived with a threshold of p < 0.05 FWE corrected and superimposed on a standard T1 template. Color scale represents t statistics. Image labels: L = left, R = right.

