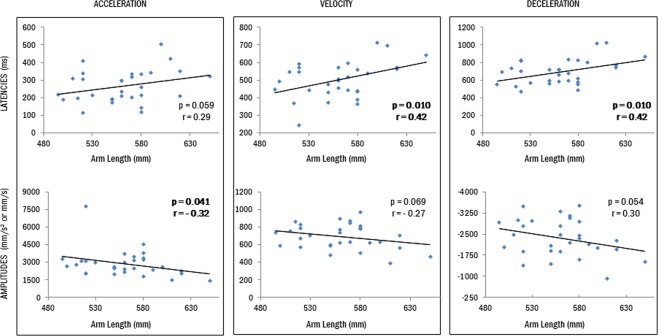
Figure 5.
Correlation between kinematic parameters (peak latencies and amplitudes) and participants’ arm length. The graphs show the time at which each subject reached a particular peak (upper panels) and the amplitude of the peak (bottom panels) from the pre tool use session, plotted against the participants’ arm length. Each dot represents a subject (N = 30). Significant correlations are indicated in bold. The longer the participants’ arms, the longer their latencies and the lower the peaks amplitude.

