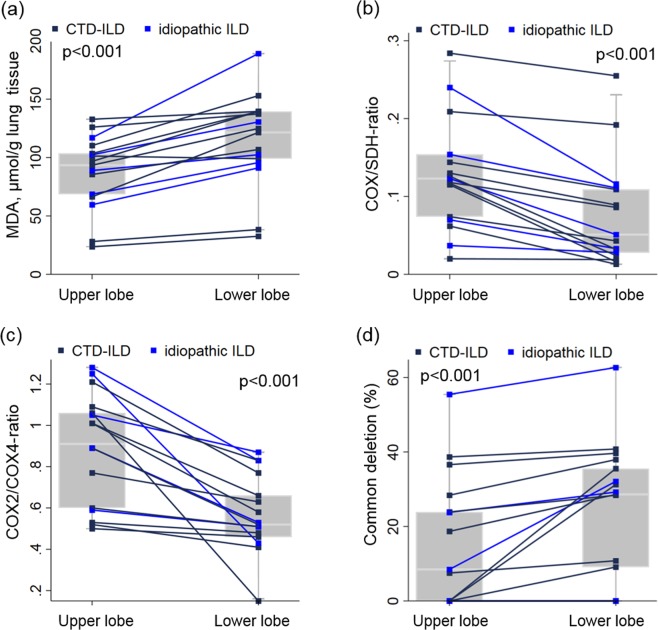
Figure 2.
Comparison of lung biopsy sites (upper vs. lower lobes) for (a) ROS-formation, (b) mtDNA encoded respiratory chain function, (c) mtDNA-encoded protein, (d) mtDNA mutations in those 17 ILD-patients in whom simultaneous biopsies were performed. Lines connect measurements from the same patient. Boxes represent the 25th, 50th and 75th percentiles; whiskers define the lowest and highest data point within 1.5 times the interquartile range.

