Figure 4.
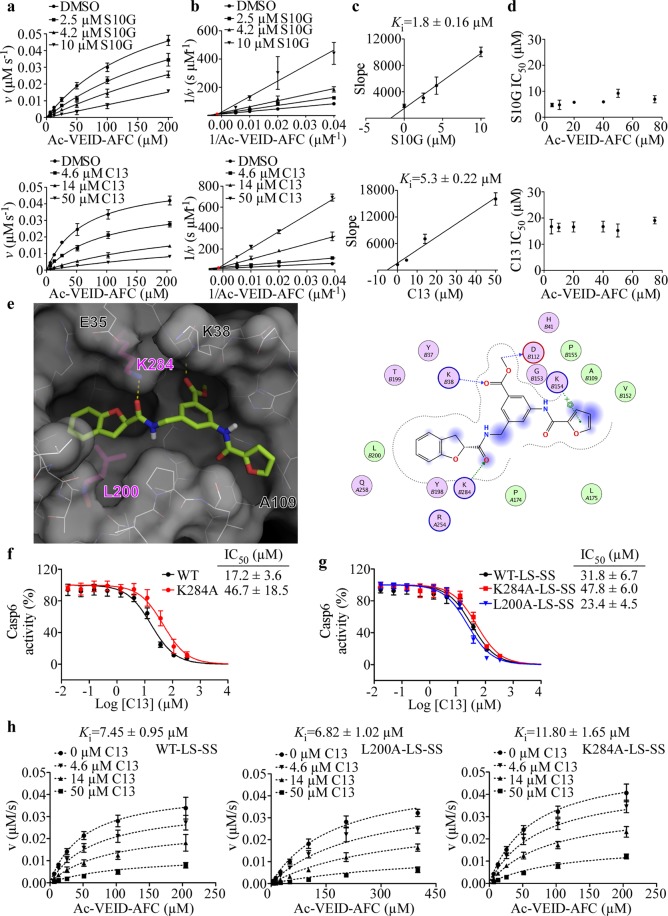
Compounds S10G and C13 inhibit Casp6 through a noncompetitive mode of inhibition. (a) Michaelis-Menten kinetic plots of Casp6 enzymatic activity in presence of 1% DMSO or increasing doses S10G (top) and C13 (bottom). Data points represent mean ± SD of three independent experiments. (b) Lineweaver-Burk plots of Casp6 inhibition with S10G (top) and C13 (bottom). Red circle indicates the point where lines converge. (c) The relationship between the slopes of lines in Lineweaver-Burk plot analyses in panel (b) and inhibitor concentration. (d) Plots of IC50 values for S10G (top) and C13 (bottom) with varying concentrations of Ac-VEID-AFC substrate. Data points represent mean ± SD from three independent experiments for each substrate concentration. (e) Binding model of C13 into CASP6 putative allosteric site, derived from molecular docking. Left: C13 (green sticks) occupies the putative allosteric site (white surface and lines; Ala-mutated residues L200 and K284 shown as purple sticks). Right: predicted interactions with Casp6 allosteric pocket residues (pink balls polar, circled blue or red for basic and acidic, respectively. Green balls = hydrophobic. Dotted-arrow: blue and green for backbone and sidechain hydrogen-bond interactions, respectively. Blue shade = solvent exposed area). Dose-response curves of C13 for Casp6-WT and Casp6-K284A (f), and copurified LS and SS of Casp6-WT-LS-SS, Casp6-L200A-LS-SS, and Casp6-K284A-LS-SS (g). Data represent mean ± SD from at least three independent experiments. (h) Global fit of kinetics data to a noncompetitive (mixed) inhibition model for Casp6-WT-LS-SS (left panel, R2 = 0.9635), Casp6-L200A-LS-SS (middle panel, R2 = 0.9699), and Casp6-K284A-LS-SS (right panel, R2 = 0.9794) in the presence of 0–50 µM C13. Data points on the graph represent the mean ± SD, and calculated Ki values represent mean ± standard error (SE) from three independent experiments.

