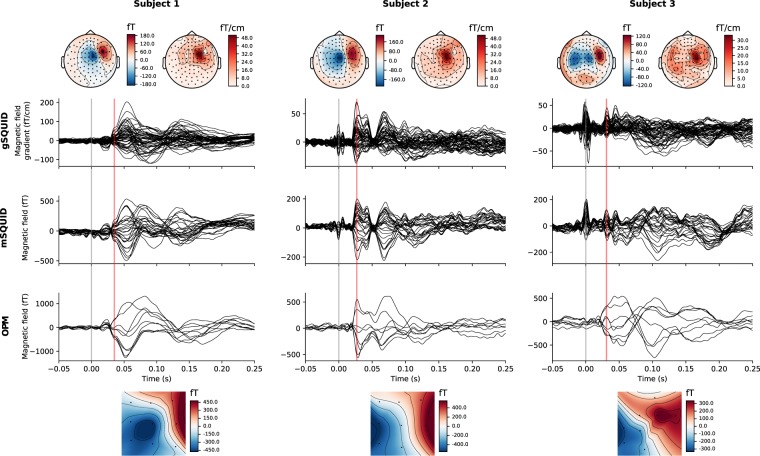
Figure 5.
Somatosensory evoked fields for the OPM and SQUID measurements for all three subjects. Responses only at a subset of SQUID channels are shown for easier interpretation: 27 magnetometers (mSQUID) and 54 gradiometers (gSQUID) covering the right somatomotor cortex. The stimulus onset is indicated by a grey line. Equivalent current dipoles were fitted at the latency indicated by the red vertical line. Topographic maps at this latency for each sensor type are also shown (SQUID magnetometers and gradiometers above, OPMs below the SEF traces). For the SQUID gradiometer topographic maps, the RMS value of each gradiometer pair is shown. Stimulus artifacts can be seen in SQUID signals at 0 ms, especially for Subject 3.

