Figure 5.
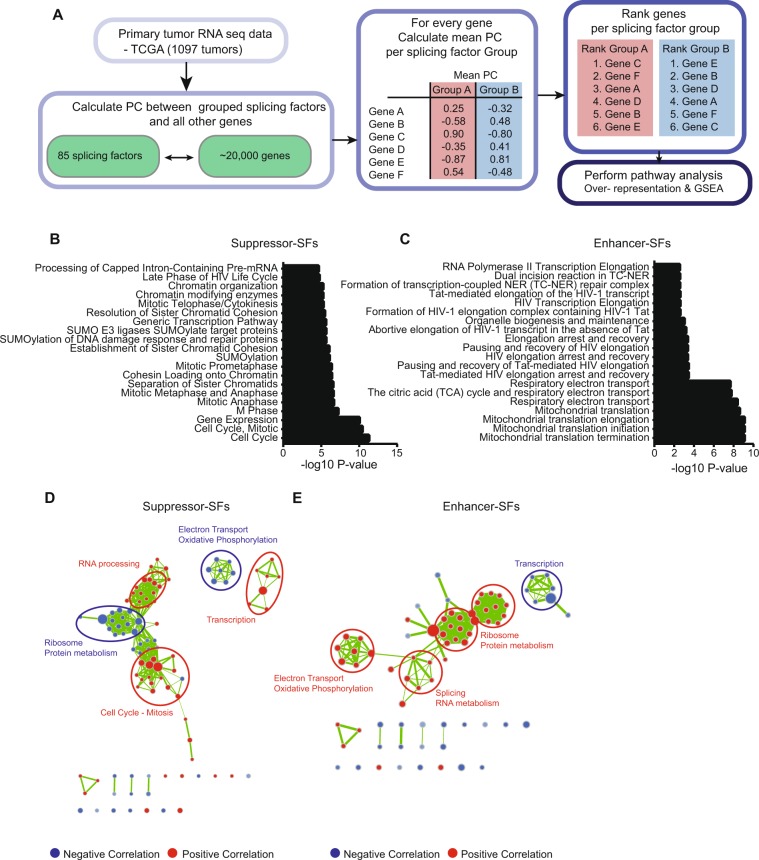
Association of Enhancer-SF expression levels with cancer-related biological programs. (A) Schematic overview of steps used to correlate Enhancer- and Suppressor-SF expression to other genes in the genome followed by over-representation and gene-set enrichment analyses. (B) Top altered pathways in over-representation analysis of the top 500 genes positively correlating with Suppressor-SFs. (C) Top altered pathways in over-representation analysis of the top 500 genes positively correlating with Enhancer-SFs. (D) Cytoscape visualization of GSEA of pathways highly correlated to Suppressor-SFs. (E) Same as in (D) but for Enhancer-SFs.

