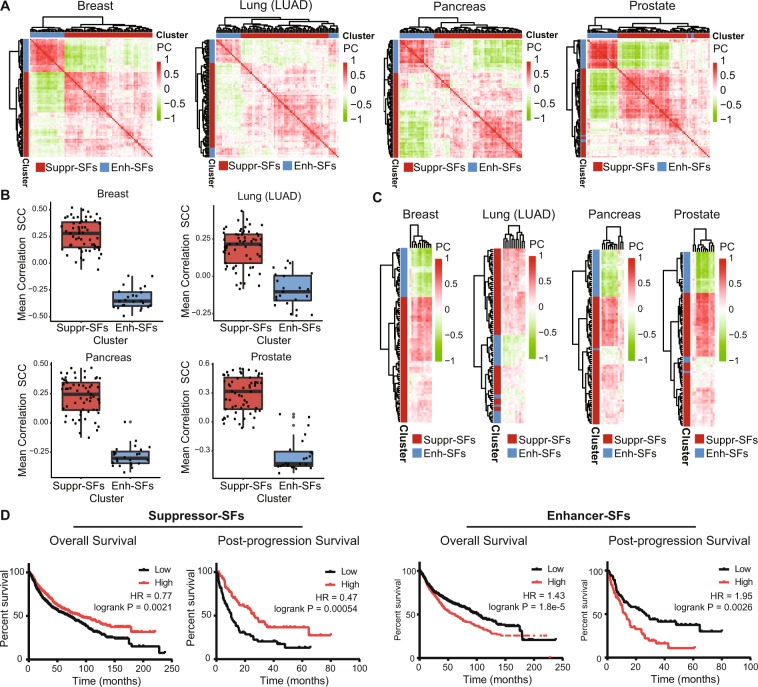
Figure 6.
Enhancer-SF and Suppressor-SF expression levels are related to cancer progression in a wide variety of cancer types. (A) Hierarchical clustering (Euclidean distance, complete linkage) of Enhancer- and Suppressor-SF correlations in various cancer types. Red = highly positively correlated, green = highly negatively correlated. (B) Mean correlation of Suppressor- and Enhancer-SFs to the sister chromatid cohesion pathway in various cancer types. Here, for every SF, the correlation to the SCC pathway was calculated per patient, after which the mean patient correlation was calculated. (C) Hierarchical clustering (Euclidean distance, complete linkage) of PCs of Suppressor- and Enhancer-SFs to sister chromatid cohesion factors. (D) Per lung cancer patient, mean expression of all Suppressor- and Enhancer-SFs was calculated. Based on these expression levels, the patient cohort was median-split and overall and post-progression survival plots were generated26.

