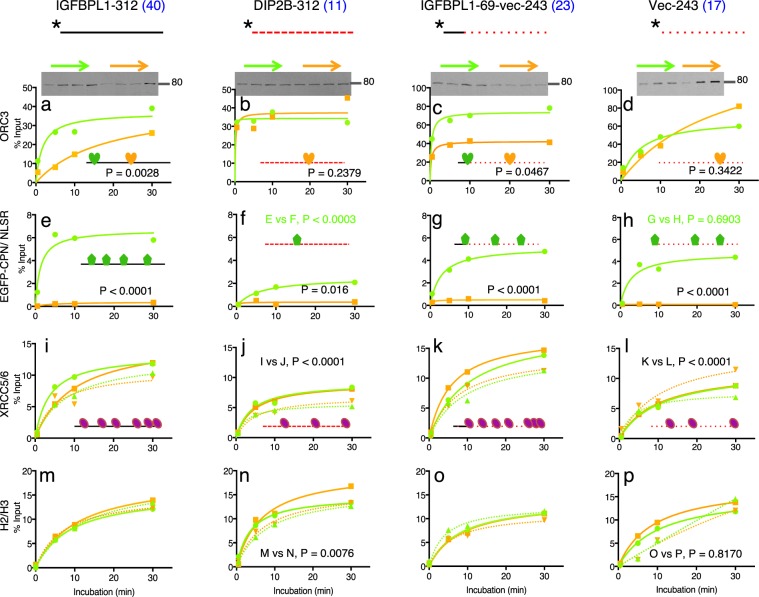
Figure 4.
Binding kinetics of nuclear proteins to 4 different DNA baits in the presence and absence of EGFP-CPN. Investigated proteins: ORC3 in (a–d); EGFP-CPN and EGFP-NLSR in (e–h); XRCC5 (solid) and XRCC6 (dotted) in (i–l); H2 (dotted) and H3 (solid) in (m–p). Baits used for the binding are shown above the kinetics graphs along with the number of CpG (blue) counted from 5′ to 3′. *Indicates biotinylated 5′ end of baits. Green and orange kinetics indicate data obtained with EGFP-CPN-containing and EGFP-NLSR-containing nuclear extracts, respectively. Each point on the graphs represents an average of 2 independent kinetics data, but p-values of ANOVA test are calculated with all the independent points (not from the averages). Inserted cartoon suggests protein binding to the bait. Full-length blots for Fig. 4. (a through l) are presented in Supplementary Fig. S3.

