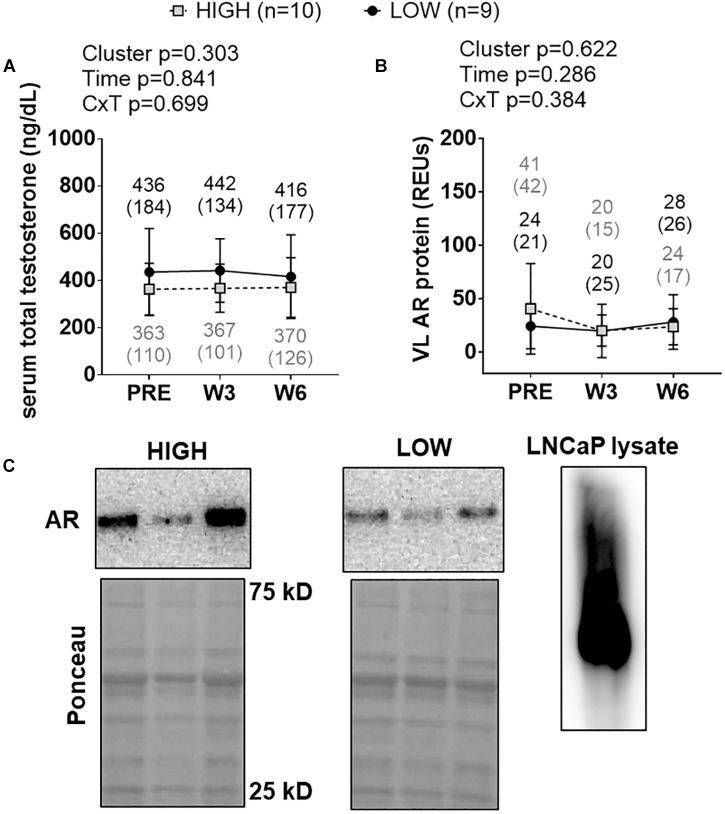
FIGURE 7.
PRE, W3, and W6 androgen signaling biomarker differences between LOW and HIGH responders. There were no significant cluster effects, time effects or cluster × time interactions for serum total testosterone levels (A) or muscle androgen receptor (AR) protein levels (B). Cluster means at each time point are presented above line graphs as mean (standard deviation) values. Values presented in line graphs are mean (standard deviation) values. (C) Representative Western blot image for a low and high responder. Right inset of (C) demonstrates that our AR antibody yielded one prominent band for LNCaP cell lysates, and this band was in line with muscle AR content that was quantified.

