Fig. 5.
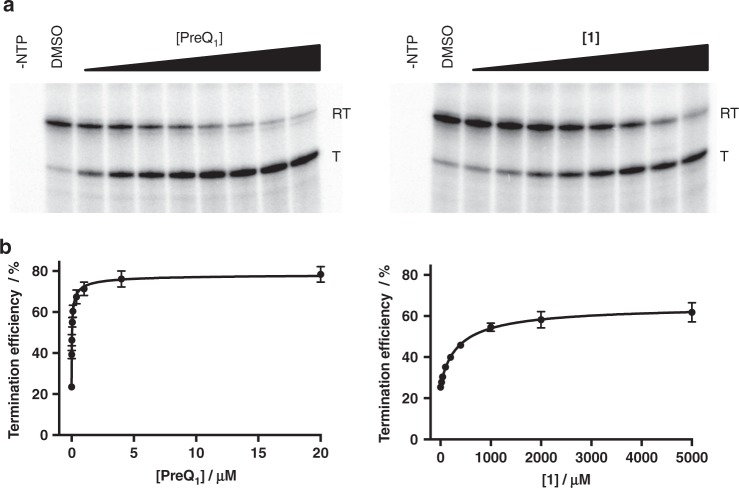
Transcription termination assay of 1. a Representative gel images of the 32P-labeled RNA products of in vitro transcription of the Ss PreQ1-RS template in the presence of increasing concentrations of PreQ1 (left) and 1 (right). Bands corresponding to the read-through transcription product (RT) and terminated transcription product (T) are indicated. Full gel images are provided in the Supplementary Information. b Quantification of transcription termination efficiency of increasing concentrations of PreQ1 (left) or 1 (right). Error bars indicate standard deviation, n = 3. Source data are provided as a Source Data file

