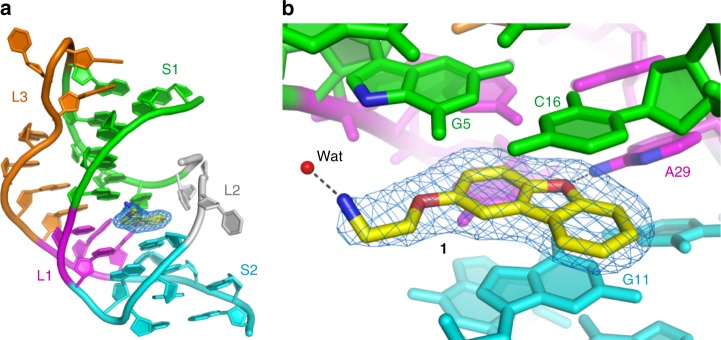
Fig. 6.
Co-crystal structure of the aptamer complexed with 1. a Overall structure of the complex. S1, S2, L1, L2, and L3 are colored green, cyan, magenta, gray, and orange, respectively. The nucleotides between L3 and S2, which interact with L1, are also in magenta. Unbiased |Fo|−|Fc| electron density map for the compound 1 (blue mesh) contoured at 3.0 σ. b Detail of the ligand-binding site. Nucleotides that interact with 1 are labeled. Dotted lines denote hydrogen bonds between 1 and a bound water molecule and with A29

