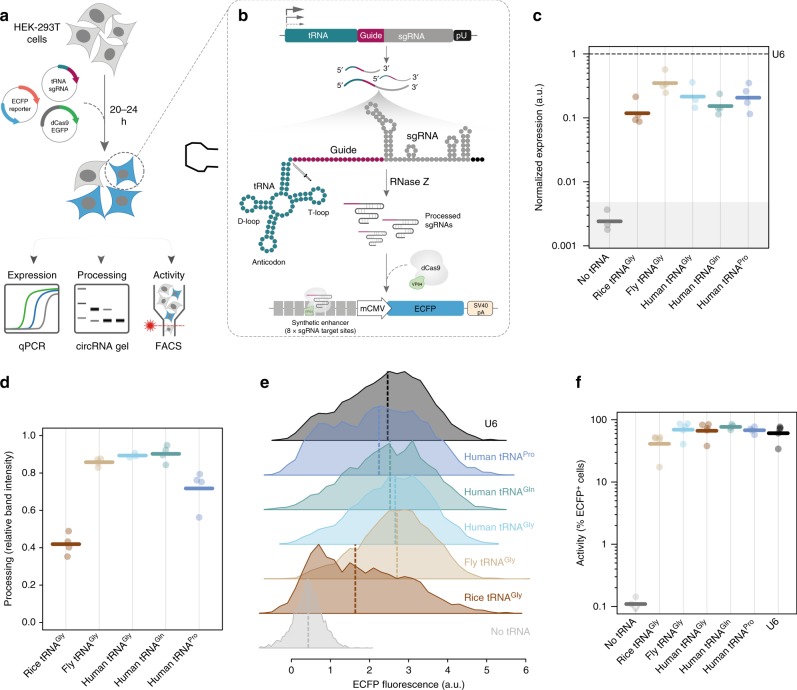
Fig. 1.
Wild-type tRNAs display strong Pol-III promoter activity and gRNA production. a Experimental strategy for testing functional gRNA production downstream of tRNAs. b Schematic diagram of molecular events occurring in cells transfected with tRNA-sgRNA constructs. c gRNA expression as measured by qPCR relative to Cas9 and U6 (ΔΔCt) (n = 4 independent experiments, n = 3 for no promoter control; dashed line = gRNA levels for U6). Shaded area represents the 75% credible mass (Bayesian Estimation Supersedes the t test (BEST) test17, 18) for the no tRNA control. d 3′ processing ability of each wild-type tRNA tested. Efficiency represents the ratio of band intensity between the unprocessed and processed bands on a 2% agarose gel following RNA circularization and nested RT-PCR (thick lines = mean values). e Representative flow cytometry histograms of reporter levels downstream of U6 and various tRNA promoters. Values represent asinh(ECFPfluoresence/150) (thick lines = median fluorescent intensities). f Percent reporter ECFP + cells within transfected cells (thick lines = geometric mean values; n = 5 independent experiments; hollow downward triangles = points at or below the limit of detection). Source data are provided as a Source Data file

