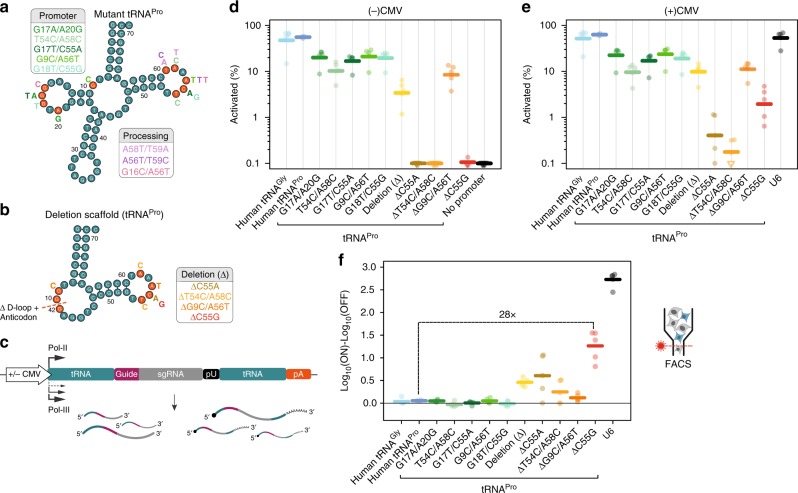
Fig. 3.
Combinatorial tRNA deletions and point mutations improve the ON−OFF specificity of Pol-II gRNA expression. a, b tRNA diagrams with mutation pairs predicted from sequencing data to affect 3′ processing only (pink tones), or promoter activity with minimal effect on processing (green/orange/red tones) (left panel). Selected pairs of mutations are shown as letters next to the wild-type (a) and ΔtRNAPro (b) scaffolds. c Constructs used to test ON/OFF ratios of each variant combination in the presence and absence of a Pol-II promoter. d, e Percentage reporter ECFP+ cells within transfected cells with (d) and without (e) a CMV promoter. Thick lines indicate geometric mean values. Each point represents an independent experiment (n = 4–5). f Log10(% ECFP+ cells) in the ON condition compared to OFF condition for each tRNA and U6 (relative to no promoter) (thick lines = mean values; n = 3–5 independent experiments). The U6 and no promoter control are shared with Fig. 1 and Supplementary Fig. 4d. ΔC55G had a >99.9% probability of decreased activity compared to U6, but a 99% probability of increase compared to parental tRNA (paired BEST tests). Source data are provided as a Source Data file

