
Figure 2.
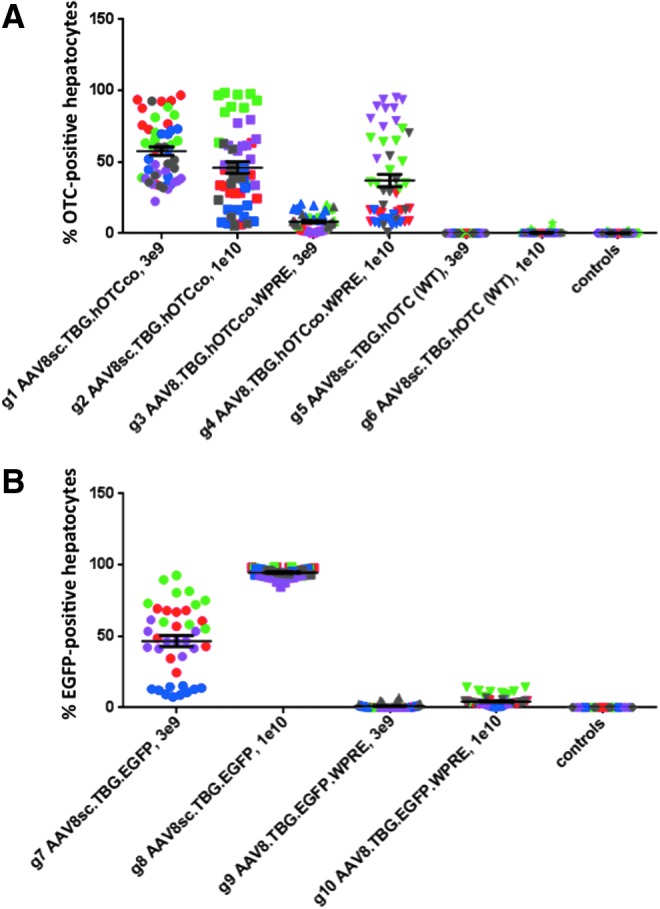
Analysis of hOTC and EGFP expression in the liver by transduced liver area. The expression levels of hOTC determined by immunostaining (A) and expression levels of EGFP determined by direct fluorescence (B) are shown from different vector constructs at two different doses (3 × 10⁹ and 1 × 10¹⁰ GC/mouse). Each data point shows the percentage of hOTC- or EGFP-positive liver area from one image; 10 images were taken for each animal. Data points from the same animal are shown using the identical color within each group. Bars show the mean percentage of transgene-positive liver area ± the standard error of the mean. Group numbers (A: g1–g6; B: g7–g10), type of vector, and dose are indicated.