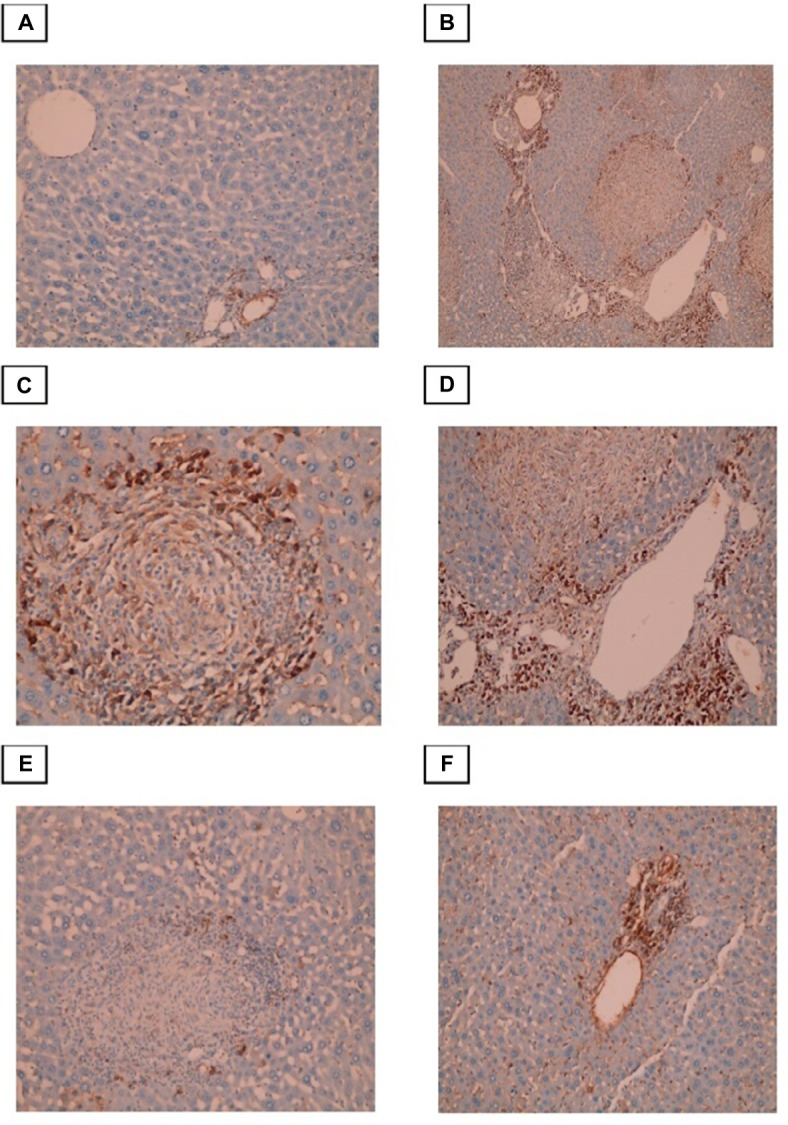
Figure 5.

Photomicrographs of the liver stained with Masson trichrome.
Notes: (A) Control group, showing normal (typical) distribution of connective tissue (×100). (B) Infected untreated group, showing granulomatous lesions with condensed fibrous connective tissue in the granuloma and portal tracts (×200). (C)Portal-portal bridging fibrosis (×100). (D)-Portal tract that showing marked dilatation of portal vein and excess fibrosis (×200). (E) PZQ treated group. (F) Eugenol treated group, showing reduced size and number of granuloma with less fibrous tissue in the granuloma and portal tracts (×100).
