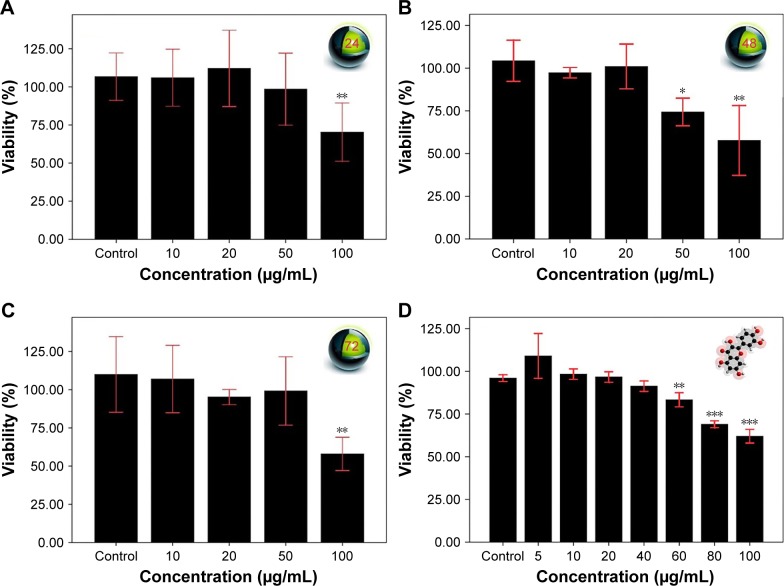
Figure 3.
Effect of different treatments on the viability of PC12 cells. Cell viability was determined by MTT assay. PC12 cells were treated with 10, 20, 50, and 100 µg/mL for 24 (A), 48 (B), and 72 hours (C). (D) PC12 cells were treated with 5, 10, 20, 40, 60, 80, and 100 µg/mL for 24 hours. There were significant differences between the viability of PC12 cells from different treatments (P<0.05). Data are presented as the mean ± SD, n=3, *P<0.05, **P<0.01, and ***P<0.001 vs control group.

