
Fig. 1.
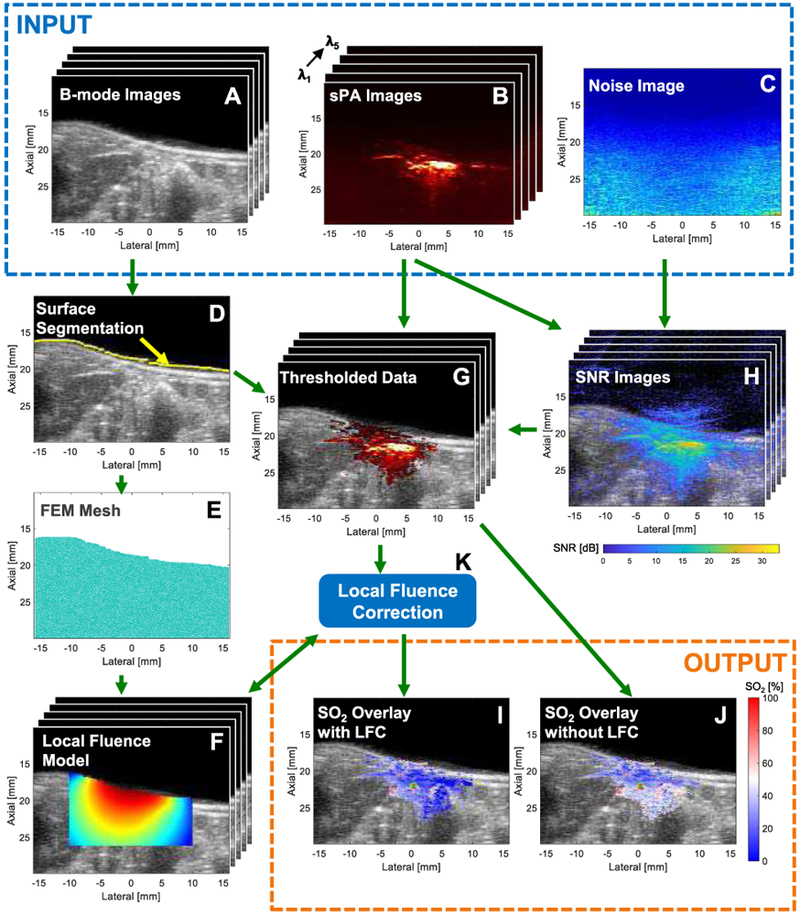
Stacks (i.e., λ1..λN) of co-registered (A) B-mode US images and (B) sPA images for all 5 acquisition wavelengths with corresponding (C) PA noise image. (D) B-mode image showing tissue-surface segmentation (yellow). (E) 2D FEM mesh of ROI and (F) stack of local fluence estimates presented on a log scale. (G) Stack of SNR-thresholded PAUS images, (H) Stack of SNR-US overlays, and (K) LFC procedure. SO2 overlays (I) with and (J) without LFC.