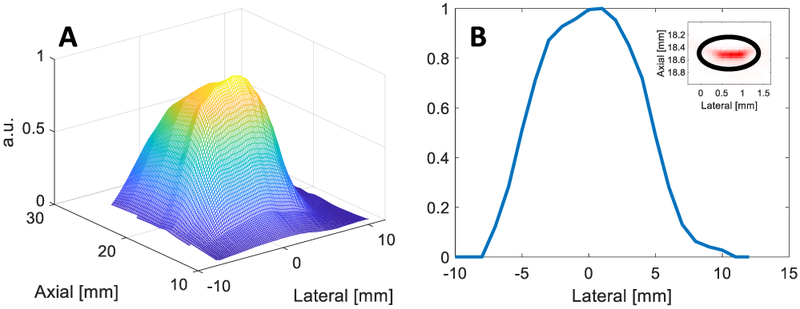
Fig. 3.

(A) Surface plot of normalized tissue-surface fluence as a function of axial and lateral position. (B) Plot of normalized tissue-surface fluence as function of lateral position at a fixed axial position (18.5 mm) with an inset showing acquired PA image of ball bearing with analysis ROI at 710 nm.
