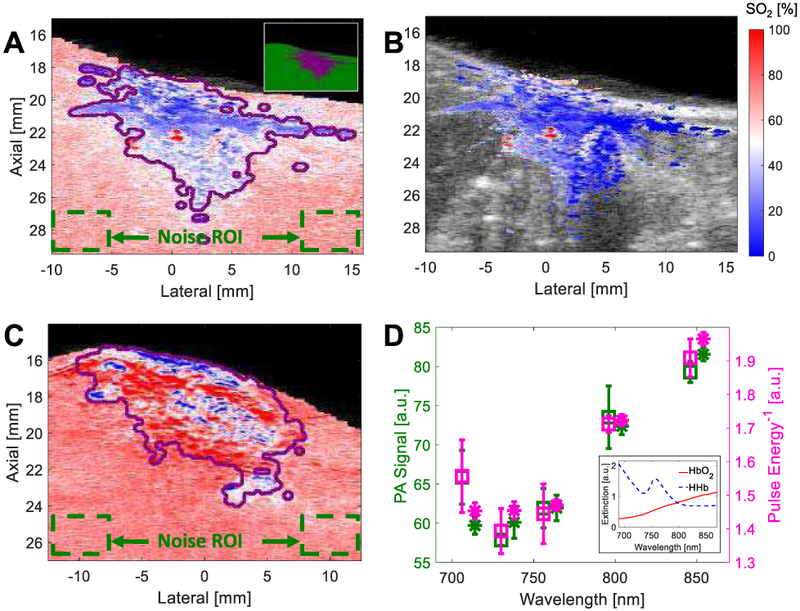
Fig. 4.

SO2 image overlays of (A) ex vivo Rat 2 without LFC or SNR masking (but mask outline in purple) with inset offering example of SNR “Mask” (purple) and “1-Mask” (green) regions; (B) ex vivo Rat 2 with LFC and SNR masking; and (C) in vivo Rat 2 without LFC or SNR masking. (D) PA signal for noise ROI and reciprocal of pulse-energy spectrum for ex vivo (squares) and in vivo (asterisks) rats; inset shows extinction spectra of HbO2 and HHb.
