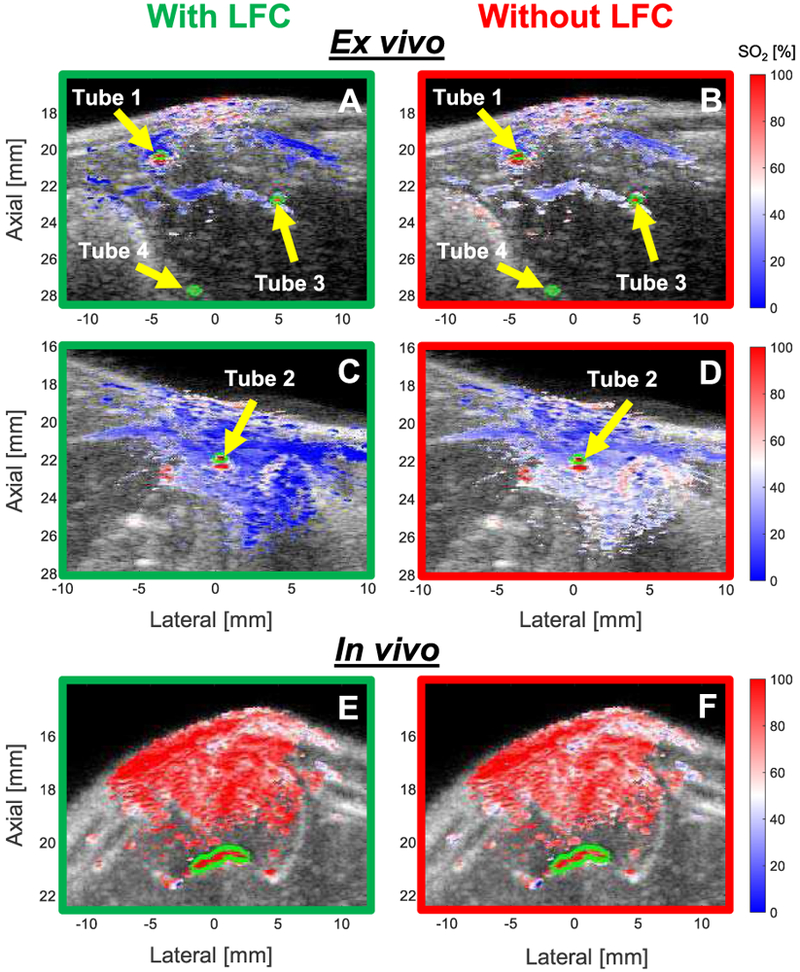
Fig. 5.

SO2 image overlays with (green border) and without (red border) LFC in representative frames from: (A – with, B – without) ex vivo Rat 1 (Tubes 1, 3, & 4); (C – with, D – without) ex vivo Rat 2 (Tube 2); and (E – with, F – without) artery (outlined in lime green) in in vivo Rat 10.
