
Fig. 8.
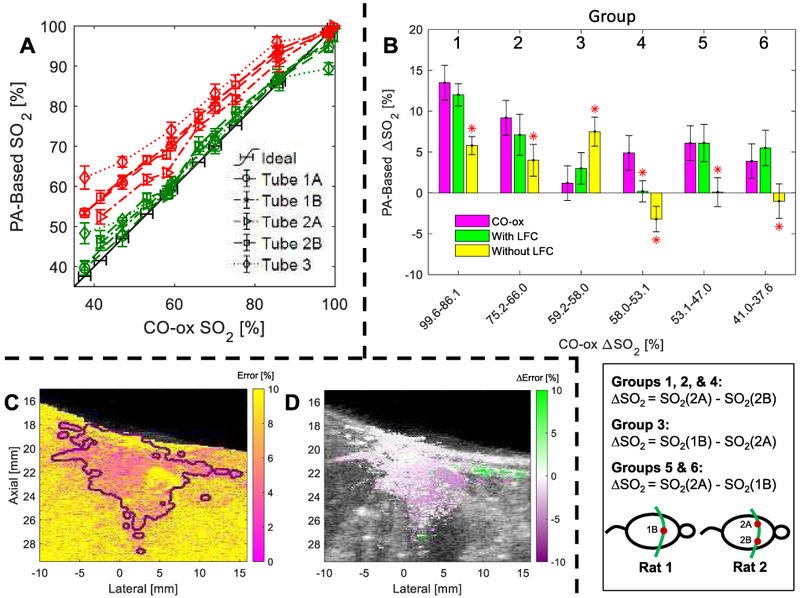
(A) Error-bar plot of PA-based SO2 estimation vs. CO-oximeter measurements in each tube (denoted by marker type) with (green) and without (red) LFC. (B) Comparison of estimated ΔSO2 using blood samples of different SO2 with (green) and without (yellow) LFC compared to CO-oximeter measurements (purple) in different tubes, as depicted in the schematic below the plot. An asterisk denotes a significant difference in ΔSO2 estimate compared to the matched CO-ox result. Representative example of (C) relative model error and (D) reduction of model error following LFC for ex vivo Rat 2.