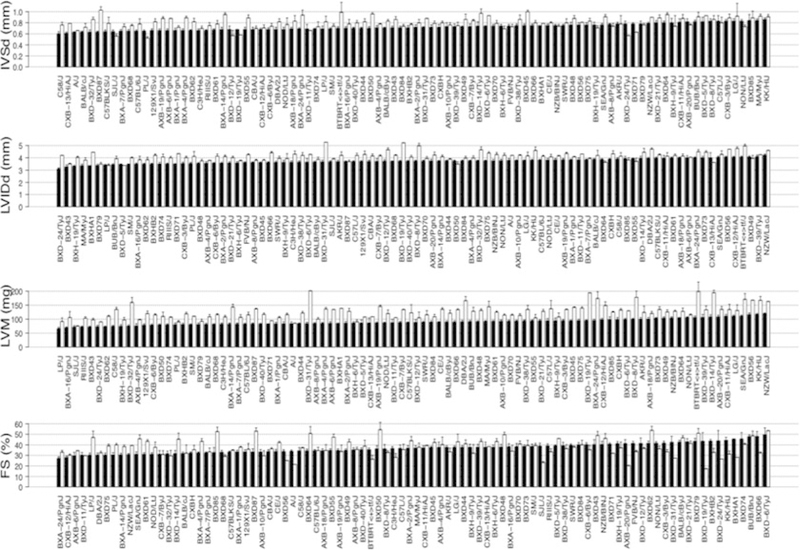
Fig. 2.
Variation in echocardiographic measures of cardiac structure and function among HMDP mouse strains. Black bars represent measurements under the baseline condition in ranked order. White bars represent measurements after 3 weeks of continuous ISO infusion. IVSd Interventricular septal wall thickness, LVIDd Left ventricular diastolic diameter, LVM Left ventricular mass, FS Fractional shortening. Error bars represent the standard errors of the means

