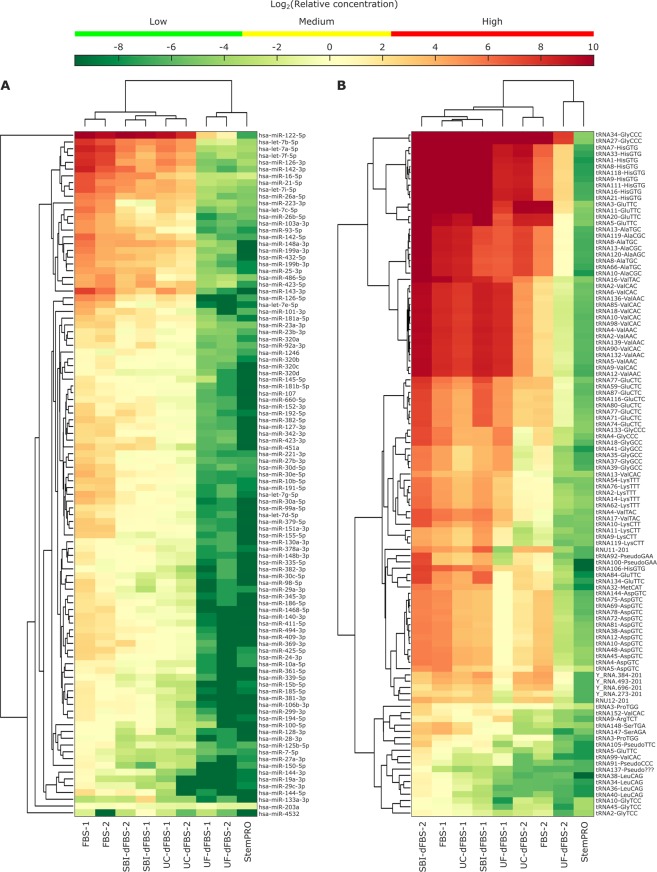
Figure 6.
Unsupervised clustering analysis of the most abundant miRNAs (A) and other small ncRNAs (B). Top 60 most abundant miRNAs and top 40 most abundant other small ncRNAs in any samples were selected for the clustering analysis, resulting in 101 miRNAs and 109 other small ncRNAs. Heatmaps are showing the relative concentration of each RNA, normalized using the spike-in miRNAs. Medium level refers to the concentration range of spike-ins, whereas low level is lower than any of the spike-ins and high level is higher than any of the spike-ins used.

