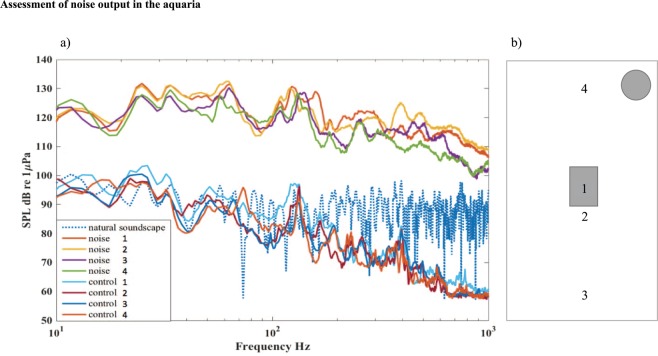
Figure 4.
Assessment of noise output in the aquaria. (a) Power spectra for noise and control treatments shown for 0–1 kHz. Sound pressure level was on average 34 dB higher for noise than for control in this frequency range (36 dB for 0–12 kHz). For comparison, we have also included the sound spectrum recorded in the bay where fish were collected (natural soundscape). (b) Map of sound measurements 2015 within the aquaria. Noise levels were measured with a hydrophone, placed at four different locations in the experimental aquaria: (1) in the nest, (2) 10 cm in front of the nest, (3) 20 cm in front of the nest and (4) is 10 cm behind the nest, near the sound source (marked as a round grey circle). The four lines shown in (a) represent each of these four positions. All measurments were done without fish in the aquarium.

