Fig. 5.
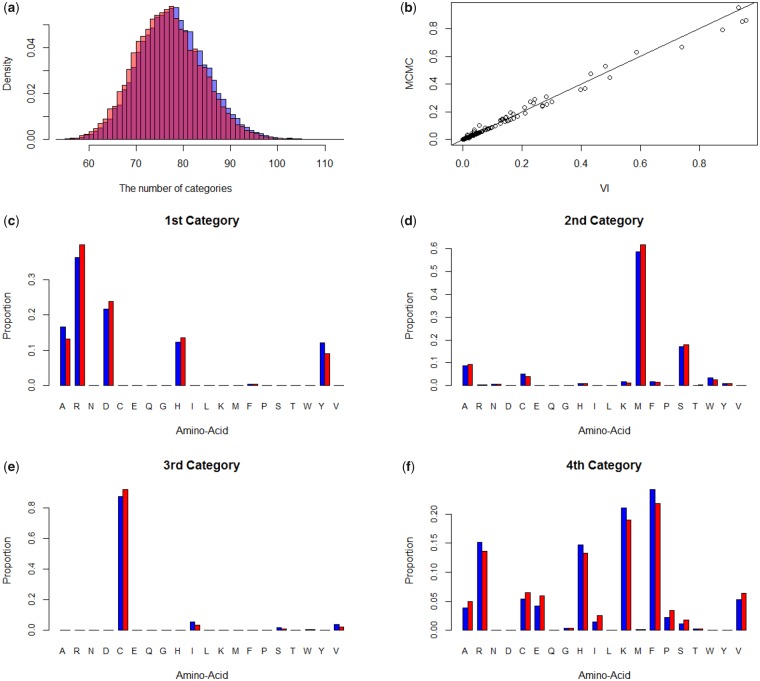
The MCMC and variational inference-based posterior distributions of the number of site categories and the amino acid profiles based on a mitochondrial data set (13 taxa and 6,622 amino acid positions; Rodríguez-Ezpeleta et al. 2006). (a) The posterior distributions of the number of site categories, (b) mean amino acid profiles of the first 16 site categories in table 2 by variational inference versus MCMC (c–f) posterior mean amino acid profiles of the four main site categories. Blue and red colors are the posterior means by MCMC and by variational inference, respectively.

