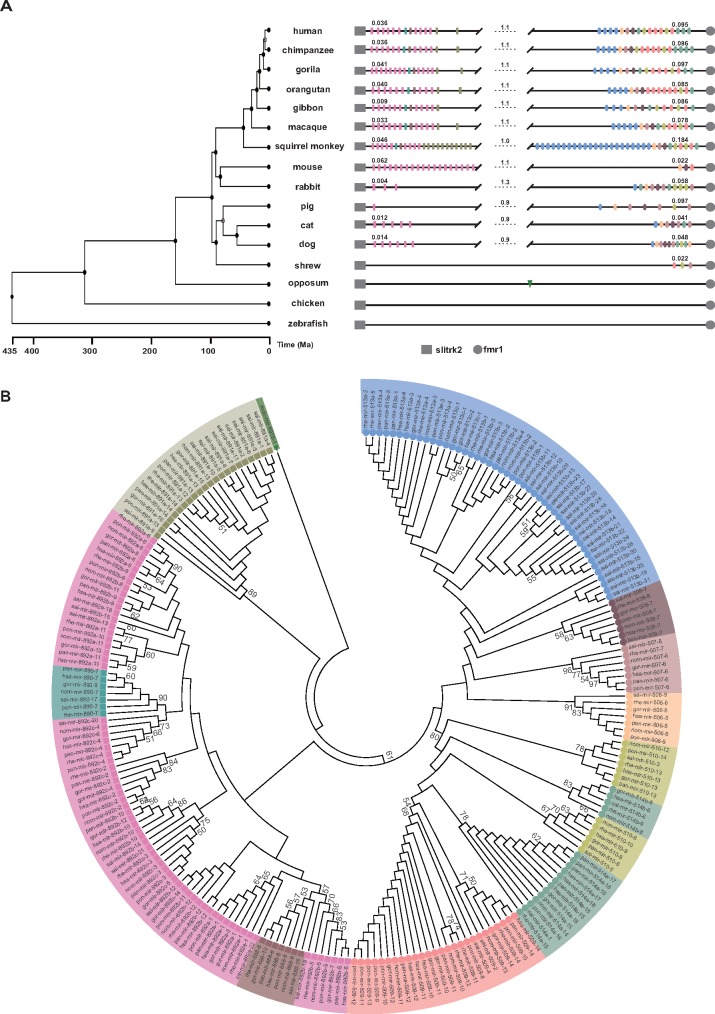
Fig. 4.
Evolutionary history of spermiRs. (A) Schematic representation of spermiRs in the genomes of representative species. The branch length on the phylogenetic tree reflects the divergence times of different species in millions of years ago (Ma) (Hedges et al. 2015). The rectangles represent spermiR-Ls, and the ellipses represent spermiR-Rs. The pink rectangles represent the miR-892 subfamily; cadet-blue, miR-890; deep khaki, miR-891; and deep salmon, miR-888. The sky-blue ellipses represent the miR-513 subfamily; light orange, miR-506; light rosybrown, miR-507; deep rosybrown, miR-508; light sea-green, miR-514; deep yellow, miR-510; and light salmon, miR-509. The green triangle represents the spermiR homolog in opossum. The physical length of the spermiR-L and spermiR-R clusters or the region between them in each species (in Mb) is indicated by the number above the lines. The genomic coordinate of each spermiR in the different species is provided in supplementary Data S4, Supplementary Material online. (B) Neighbor-joining tree of the spermiR precursor sequences (200 bp) in the representative primate species using the spermiR homolog in opossum as the outgroup. The colored shapes represent different spermiR subfamilies or outgroups, as described in (A). Only the bootstrap value ≥50 is shown.

