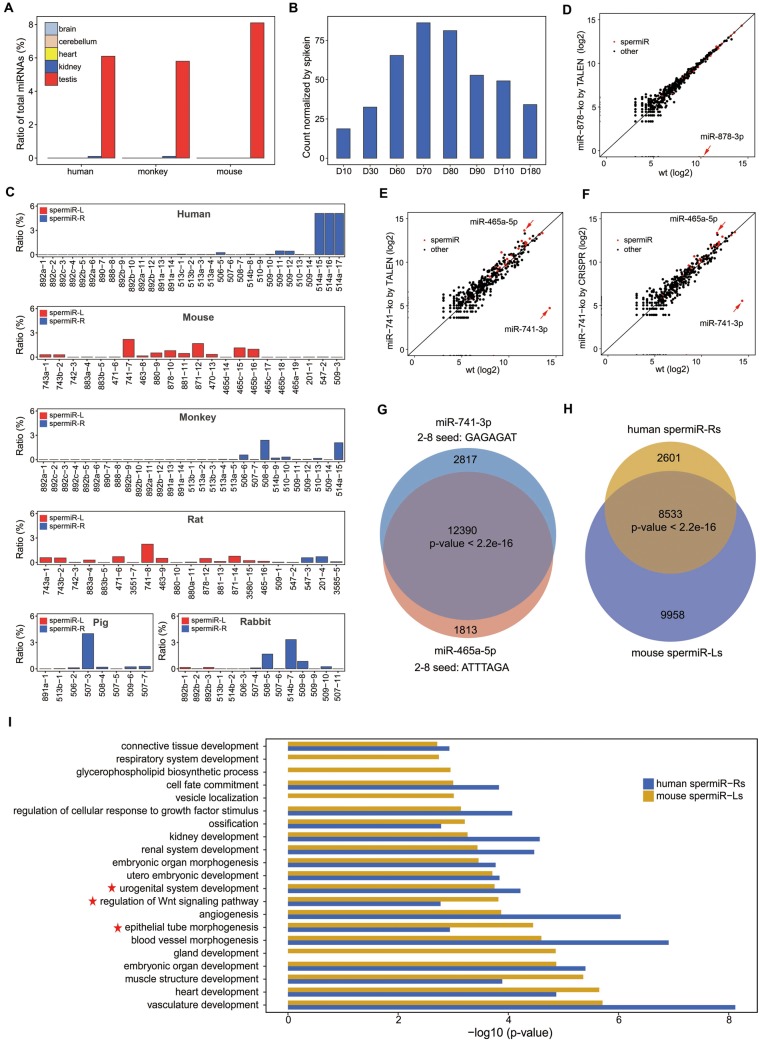
Fig. 6.
Conserved testis-specific expression pattern of spermiRs and functional compensation between spermiRs with divergent seed sequences. (A) Expression of all spermiRs relative to that of total miRNA in the different tissues from humans, monkeys, and mice. (B) Expression levels of spermiRs in the testes of rabbits at different ages. D10, 30, 60, 70, 80, 90, 110, and 180 represent postnatal days 10–180, as indicated. The count of spermiR is normalized to that of exogenous spike-ins. (C) Proportion of each spermiR relative to total miRNA in the adult testes of humans, mice, monkeys, rats, pigs, and rabbits. The order of the bars represents the physical order of the spermiRs in the genome of different species. (D–F) Expression levels of the top 200 most highly expressed miRNAs in wild-type (Wt) and miR-878 knockout SSCs (D) and in Wt and miR-741 knockout SSCs by TALEN (E) and by CRISPR (F). The expression level of each miRNA was normalized to the total miRNA abundance. In (D–F), miR-878-3p, miR-741-3p, and miR-465-5p are indicated by a red arrow. (F) Venn diagram showing the number of genes predicted to be targeted by miR-741-3p and miR-465-5p. (G) Venn diagram showing the number of genes predicted to be targeted by the top five most highly expressed spermiR-Ls in mice and the top five most highly expressed spermiR-Rs in humans. In (F) and (G), Welch’s two-sample t-test was used for statistical analysis. (H) Bar plot showing the GO term categories of the genes predicted to be targeted by the five most highly expressed spermiR-Ls in mice and spermiR-Rs in humans. The P values of the top 20 GO term categories with the highest fold enrichment are plotted. GO terms related to cell differentiation, epithelial tube morphogenesis, and male reproductive-related pathways are indicated with red five-pointed stars.

