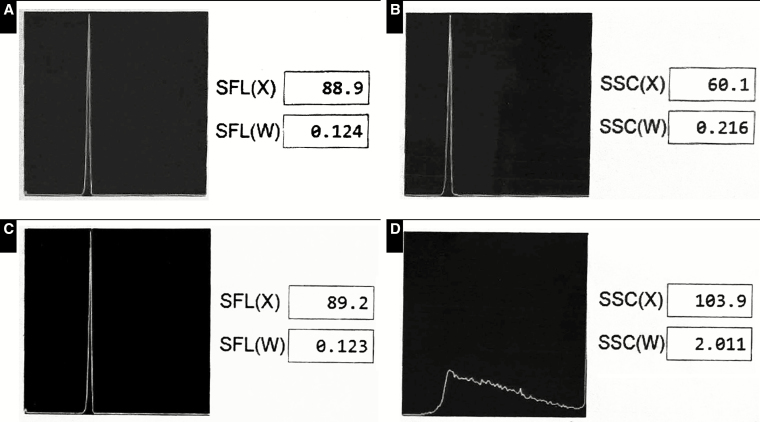
Figure 4.
Standard beads were run on the instrument by the manufacturer representative and the results captured on propriety manufacturer software. Screenshots of the results were captured on a cell phone, cropped and color adjusted to create the composite shown here. Top two panels (A, C) represent forward scatter, including x-axis location of the peak (SFL(X)) and distribution width (SFL(W)). Bottom two panels (B, D) represent side scatter, including x-axis location of the peak (SSC(X)) and distribution width (SSC(W)). The distributed antenna system (DAS) antenna was disconnected in panels A and B and powered up in panels C and D. Panels A, B, and C are the expected results for a properly functioning instrument, while panel D shows a significant anomaly in the side scatter when the DAS antenna was powered up.

