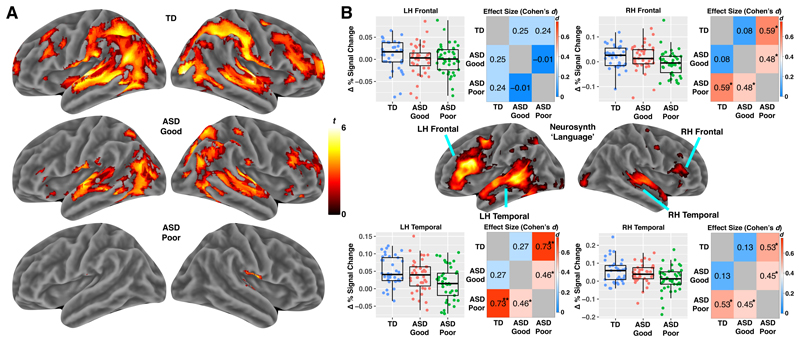
Figure 2. Reduced fMRI response to speech in ASD toddlers with poor early language outcome.
Panel A shows results of whole-brain analyses (one-tailed t-test) on each group separately (results shown at FDR q<0.05) (TD n = 37; ASD Good n = 40; ASD Poor n = 41). Panel B shows the results of region-of-interest (ROI) analyses testing for subtype differences. ROIs are defined by 4 regions within the Neurosynth ‘Language’ meta-analysis map in left (LH) or right hemisphere (RH) frontal and temporal cortex. ROI data are shown for each individual in the scatter-boxplots (TD, blue, n = 37; ASD Good, pink, n = 40; ASD Poor, green, n = 41). The box in the boxplots indicates the interquartile range (IQR; Q1 indicates the 25th, while Q3 indicates the 75th percentile) and the whiskers indicate Q1-(1.5*IQR) or Q3+(1.5*IQR). The line within the box represents the median. Matrices next to the scatter-boxplots show standardized effect sizes (Cohen’s d) for each pairwise group comparison. Cohen’s d is shown in each cell and also indicated by the color of the cell. Within each cell one star (*) indicates p<0.05, while two stars (**) indicates p<0.005.

