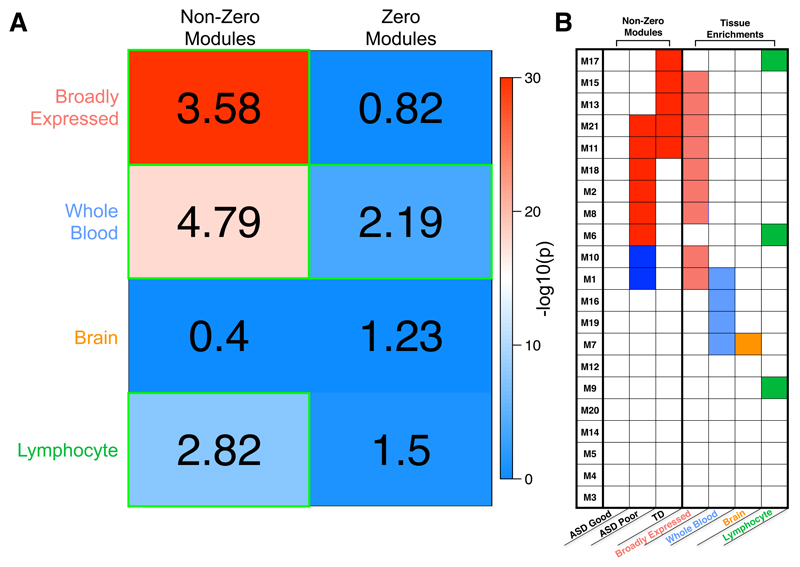
Figure 4. Tissue class enrichments with sets of non-zero or zero association modules.
Enrichments with different classes of genes taken from the Boyle et al., (2017)20 analysis of tissue-specific or broadly expressed genes from GTEx data. Within panel A, the numbers in each cell represent the enrichment odds ratio, while the coloring represents the –log10 p-value for each hypergeometric test for enrichment. Cells outlined in green pass multiple comparison correction at FDR q<0.05. In panel B, we show all gene co-expression modules (rows) and whether they are enriched for each tissue class (columns). Modules with enrichments passing FDR q<0.05 for multiple comparison correction are indicated as colored cells. The first 3 columns show which modules are those with non-zero associations (colored cells), as shown in Fig. 3b.

