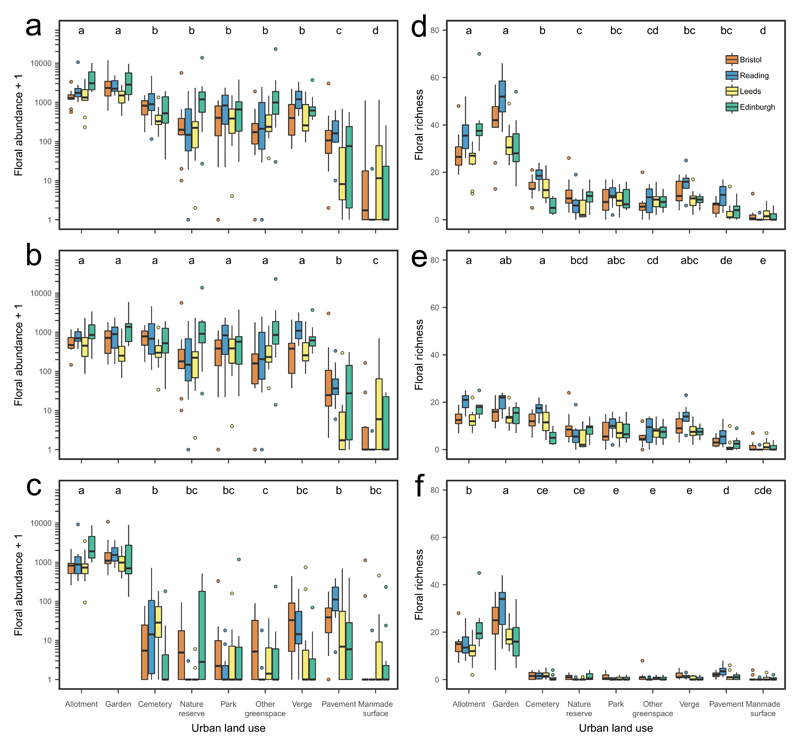
Figure 2. Floral abundance and richness for the nine urban land uses in four cities.
Box and whisker plots of the raw data for a-c log10 (x+1) floral abundance, d-f floral richness for all plant taxa (a, d), native plant taxa (b, e) and non-native plant taxa (c, f). Significantly different land uses are indicated by different letters (Tukey multiple comparisons tests). See Supplementary Table 6 for GLMM results and Tukey post hoc pairwise comparisons for all analyses. Plots show the median, 25th and 75th percentiles (lower and upper hinges), trimmed ranges that extend from the hinges to the lowest and highest values within 1.5× inter-quartile range of the hinge (lower and upper whiskers) plus outliers (filled circles).

