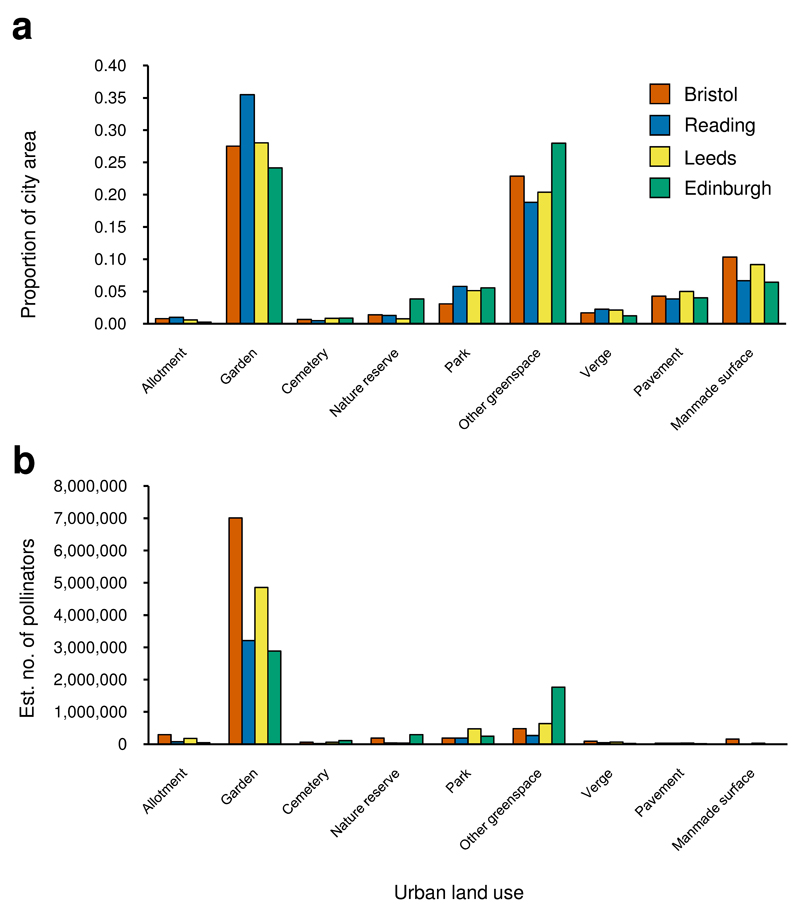
Figure 3. Land use proportions and estimated numbers of pollinators per land use at a city scale for four cities.
a, Proportions of sampled land uses and b, estimated numbers of pollinators per land use at a city scale. See Supplementary Fig. 5 for equivalent graphs for bees, hoverflies and non-syrphid Diptera. Note that in a proportions for each city do not sum to 1.00 as other non-sampled land uses (buildings, roads, railways, water) were also present; for proportions of all sampled and non-sampled land uses in each city see Supplementary Table 1.

