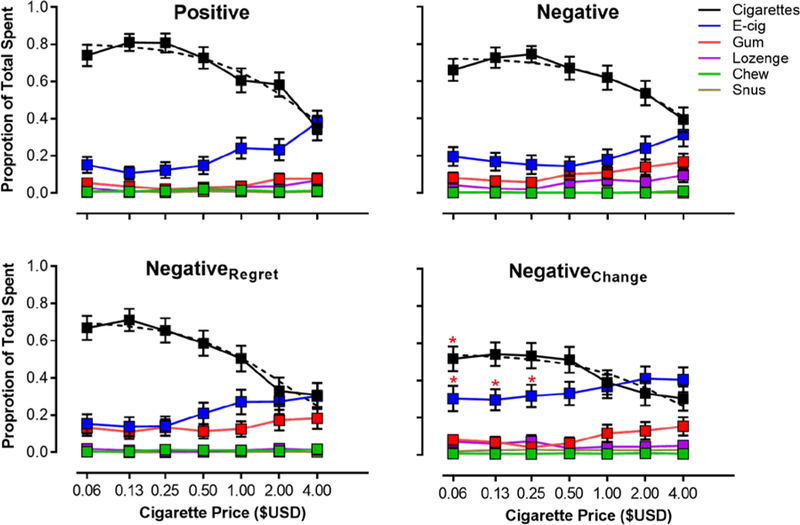
Figure 1.

ETM results for each narrative group. Dotted black lines depict the Equation 1 model fit to proportion of total spent on cigarettes at each cigarette price point. x-axis is scaled in log units. Asterisks indicate a statistically significant difference from the other narrative groups.
