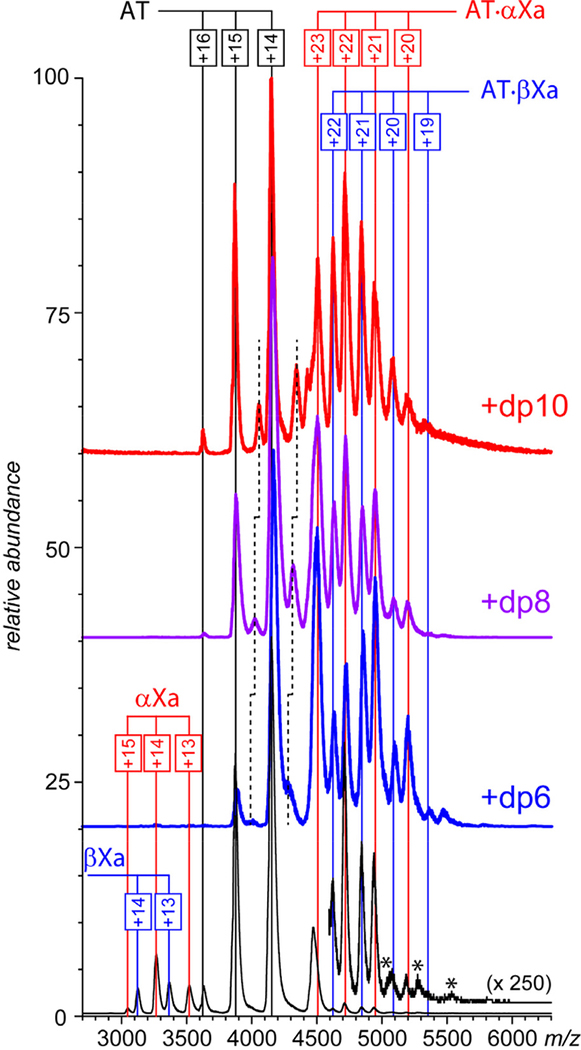
Figure 1.
ESI mass spectra of mixtures of AT (1.8 μM) and fXa (1.5 μM) incubated in the absence of hepain oligomers (bottom) and in the presence of ca. 15 μM short-chain oligomers (as indicated on each panel) in 150 mM ammonium acetate (pH 7.0). Note that the detectable fXa signal (m/z region 3,000 – 3,700) can be observed only in the absence of heparin oligomers.

