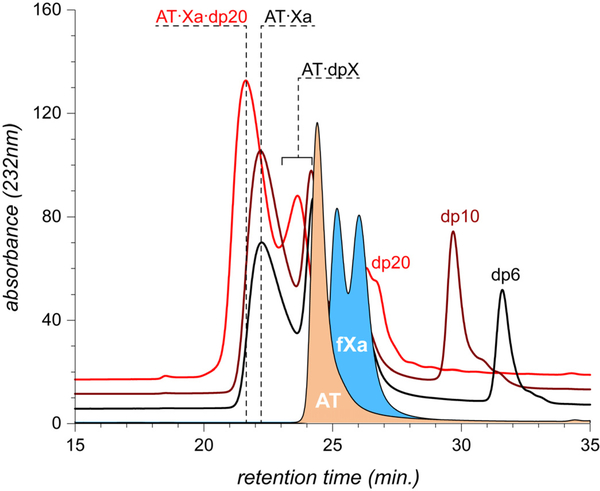
Figure 4.
SEC chromatograms of AT/fXa mixture incubated in the presence of dp6 (black trace), dp10 (brown) and dp20 (red). In all cases protein concentrations were kept at 17 μM (fXa) and 22 μM (AT), while concentrations of the heparin oligomers were adjusted to 170 μM. The traces at the bottom of the diagram correspond to AT and fXa, respectively.

