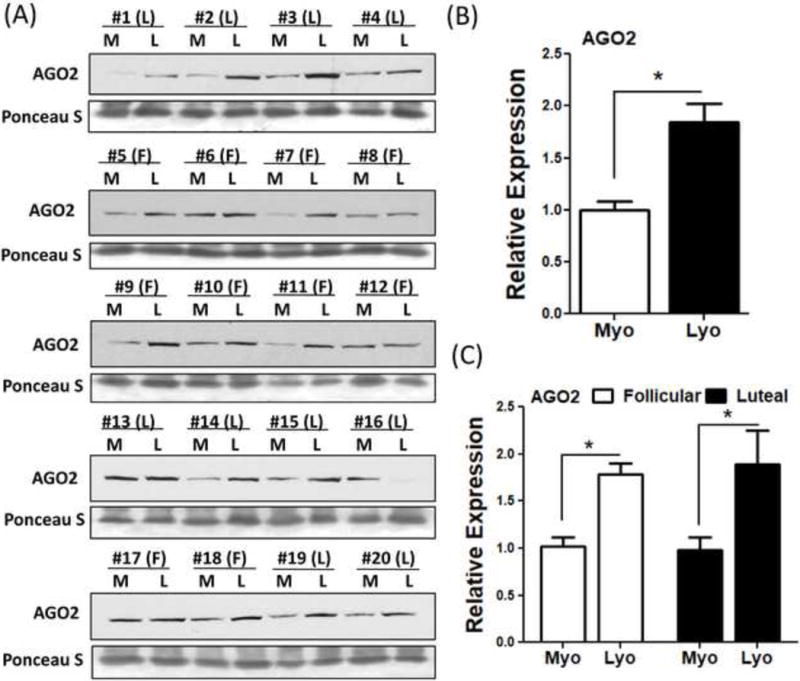
Figure 3.

Representative protein levels of AGO2 (A) in twenty paired leiomyoma tissues. The mean expression of AGO2 is shown in (B) (N=20) and separated according to menstrual cycle phase: Follicular (F, N=10) and Luteal (L, N=10) phase is shown in (C). The results are presented as mean ± SEM. *P<.05.
